IMAGE

Figure 4

ID
ZDB-IMAGE-250306-37
Source
Figures for Zhang et al., 2025
Image
Figure Caption

Figure 4

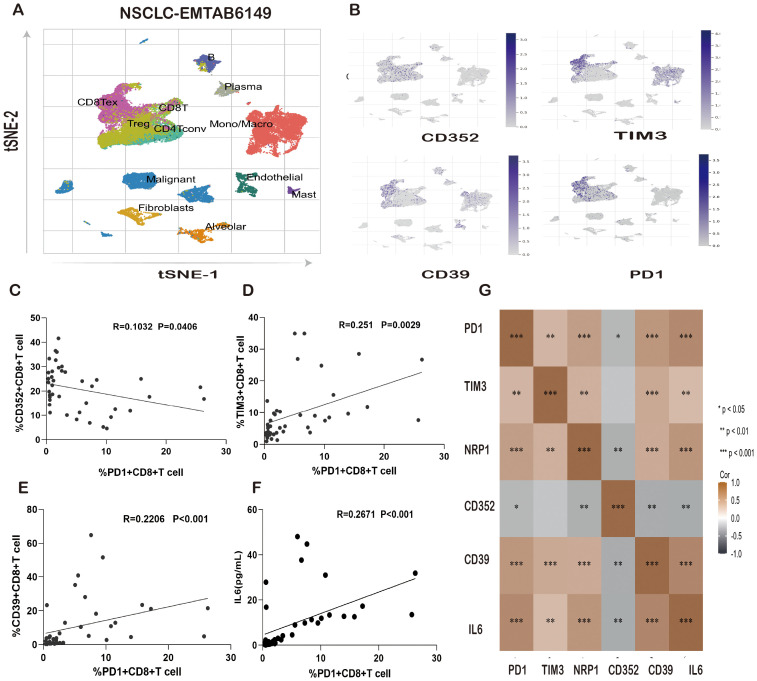
Correlation of IL-6 and PD-1 expression levels with T-cell exhaustion markers in lung cancer patients. (A) Distribution of immune cells in the NSCLC single-cell sequencing data (EMTAB6149). (B) Distribution of CD352, TIM3, CD39, and PD1 expression in the NSCLC single-cell sequencing data (EMTAB6149). (C) Correlation of the PD1+CD8+T-cell ratio with the CD352+CD8+ T-cell ratio in lung cancer patients. (D) Correlation between the PD1+ CD8+ T-cell ratio and the TIM3+CD8+ T-cell ratio in lung cancer patients. (E) Correlation between the PD1+CD8+T-cell ratio and CD39+CD8+ T-cell ratio in lung cancer patients. (F) Correlation between the PD1+CD8+ T-cell ratio and IL-6 expression in lung cancer patients. (G) Heatmap analysis of the correlation between IL-6 and PD1, TIM3, NRP1, CD352, and CD39 in patients with lung cancer. ns, not statistically significant. *P < 0.05, **P < 0.01, ***P < 0.001.

Acknowledgments
This image is the copyrighted work of the attributed author or publisher, and ZFIN has permission only to display this image to its users. Additional permissions should be obtained from the applicable author or publisher of the image. Full text @ Front Immunol