IMAGE

Figure 7

ID
ZDB-IMAGE-250306-40
Source
Figures for Zhang et al., 2025
Image
Figure Caption

Figure 7

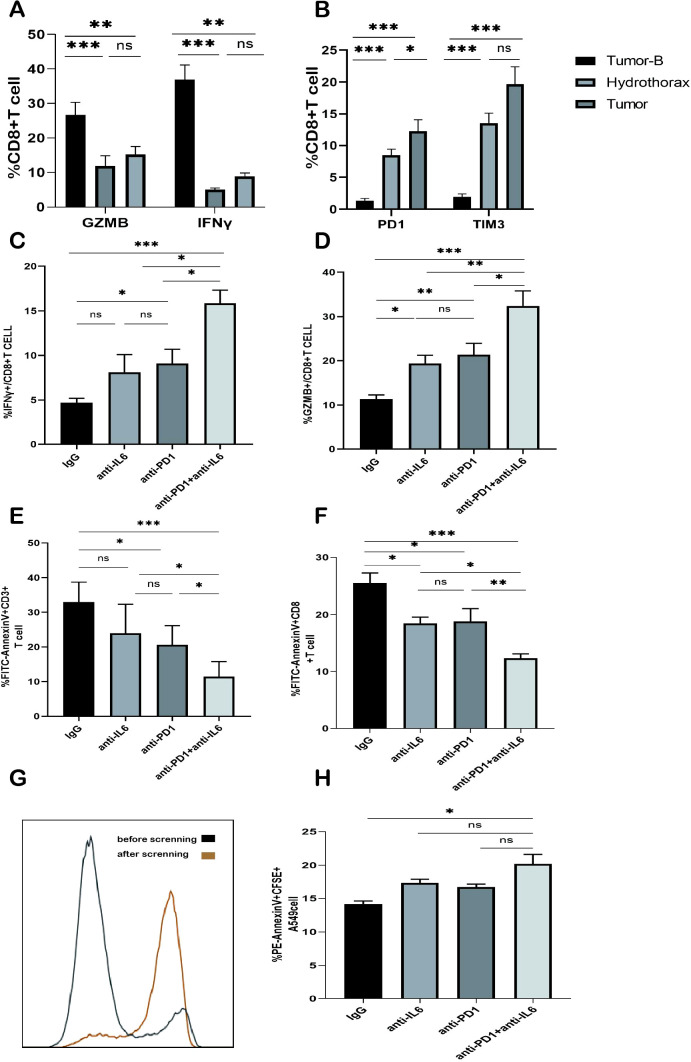
Effect of the combined blockade of PD1 and IL-6 on CD8+ T cells in vitro. (A) Frequency plot of IFN-γ and GZMB expression in CD8+ T cells of the Tumor-B, Hydrothorax, and Tumor groups. (B) Frequency plot of CD8+ T cells expressing PD1 and TIM3 in the pleural effusion of the Tumor-B group. (C) Frequency of IFN-γ expression in the pleural effusion of lung cancer patients after anti-PD1 and/or anti-IL-6 blockade. (D) Frequency of GZMB expression in the pleural effusion of lung cancer patients after anti-PD1 and/or anti-IL6 blockade. (E) Frequency of CD3+ T cell apoptosis in the pleural effusion of lung cancer patients after PD1 and/or IL-6 blockade. (F) Frequency of CD8+ T cell apoptosis in the pleural effusion of lung cancer patients after PD1 and/or IL-6 blockade. (G) CD8+ T cells before and after magnetic bead sorting. (H) Typical map and expression frequency map of A549 cell apoptosis in the pleural effusion of lung cancer patients after the blockade with PD1 and/or IL-6; ns, not statistically significant. *P < 0.05, **P < 0.01, ***P < 0.001.

Acknowledgments
This image is the copyrighted work of the attributed author or publisher, and ZFIN has permission only to display this image to its users. Additional permissions should be obtained from the applicable author or publisher of the image. Full text @ Front Immunol