|
Figure 6
Effects of IL-6

|
|
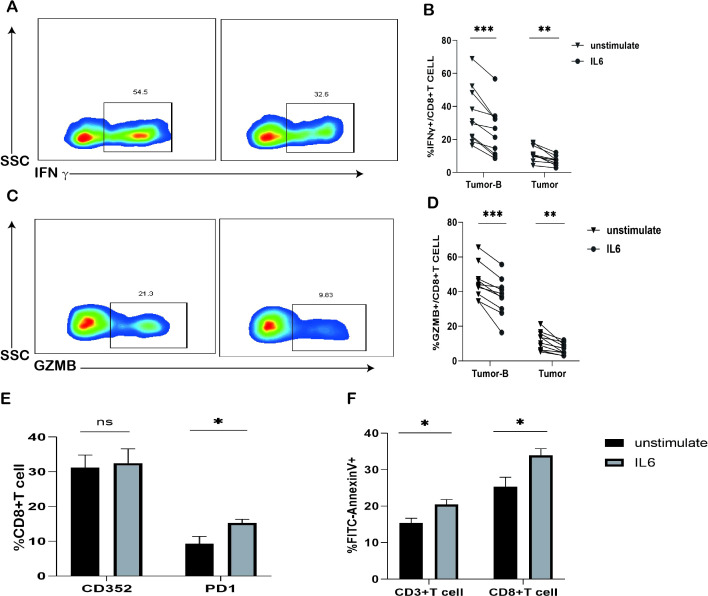
Figure 6
Effects of IL-6