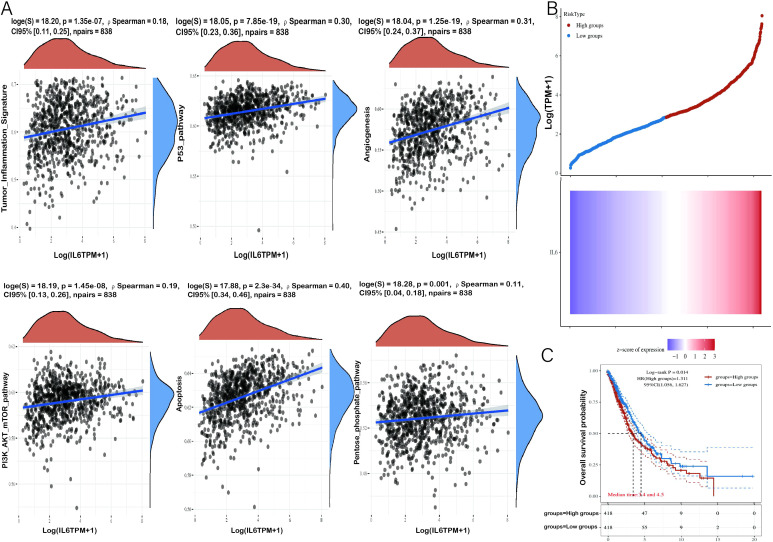
Correlation analysis of IL-6 gene with tumor-related pathways and prognosis. (A) The X-axis represents the distribution of IL-6 gene expression and the Y-axis represents the distribution of tumor signaling pathway scores. The density curves on the right side represent the distribution trend of pathway scores, and the density curves on the top side represent the distribution trend of IL-6 expression. The top values represent the results of Spearman’s correlation analysis, including p-value, correlation coefficient, and correlation calculation method. (B) The Relationship between gene expression and survival time and survival status of tumor patients in TCGA data. the upper graph represents the scatter plot of IL-6 expression from low to high, with different colors representing different expression groups; the lower graph represents the heat map of gene expression. (C) KM survival curves of the gene in TCGA data, where different groups were examined using log-rank. HR (High exp) refers to the risk coefficient of the samples in the high-expression group relative to the samples in the low-expression group. If HR > 1, the gene is a risk factor (the higher the expression, the worse the prognosis). If HR < 1, the gene is a protective factor (higher expression, better prognosis). 95% CI indicates the confidence interval of HR; median time indicates the time corresponding to the survival rate of the high expression group and the low expression group at 50% of the time. e., Median survival time in years.
Acknowledgments
This image is the copyrighted work of the attributed author or publisher, and
ZFIN has permission only to display this image to its users.
Additional permissions should be obtained from the applicable author or publisher of the image.
Full text @ Front Immunol
Your Input Welcome
Thank you for submitting comments. Your input has been emailed to ZFIN curators who may contact you if
additional information is required.
Oops. Something went wrong. Please try again later.