FIGURE

Figure 6

ID
ZDB-FIG-250306-38
Publication
Zhang et al., 2025 - Analysis of tumor-infiltrating exhausted T cells highlights IL-6 and PD1 blockade as a combined immunotherapy strategy for non-small cell lung cancer
Other Figures
All Figure Page
Back to All Figure Page
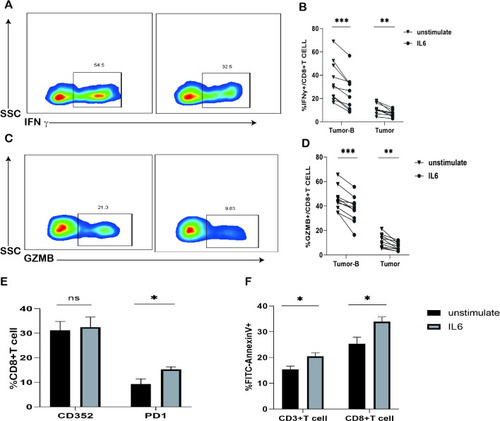
Figure 6

Effects of IL-6 in vitro stimulation on T cells. (A) Typical graph of reduced GZMB expression in CD8+ T cells in the Tumor-B and Tumor groups after 24 h of IL-6 treatment. (B) Frequency graph of reduced IFN-γ expression in CD8+ T cells of the Tumor-B and Tumor groups after 24 h of IL-6 treatment. (C) Typical graph of reduced GZMB expression in CD8+ T cells of the Tumor-B and Tumor groups after 24 h of IL-6 treatment. (D) Frequency graph of reduced GZMB expression in CD8+ T cells of the Tumor-B and Tumor groups after 24 h of IL-6 treatment. (E) Frequency graph of CD8+ T cells in the peripheral blood after stimulation with the IL-6 recombinant protein (F) Increased apoptosis of CD3+ T cells and CD8+ T cells in the peripheral blood after IL-6 treatment for 24 h. Note: Tumor-B and Tumor groups were the peripheral blood PBMC group and the cancer tissue group of patients with non-small cell lung cancer, respectively. ns, not statistically significant. *P < 0.05, **P < 0.01, ***P < 0.001.

Expression Data

Expression Detail
Antibody Labeling
Phenotype Data

Phenotype Detail
Acknowledgments
This image is the copyrighted work of the attributed author or publisher, and ZFIN has permission only to display this image to its users. Additional permissions should be obtained from the applicable author or publisher of the image. Full text @ Front Immunol