IMAGE

Figure 2

ID
ZDB-IMAGE-250306-35
Source
Figures for Zhang et al., 2025
Image
Figure Caption

Figure 2

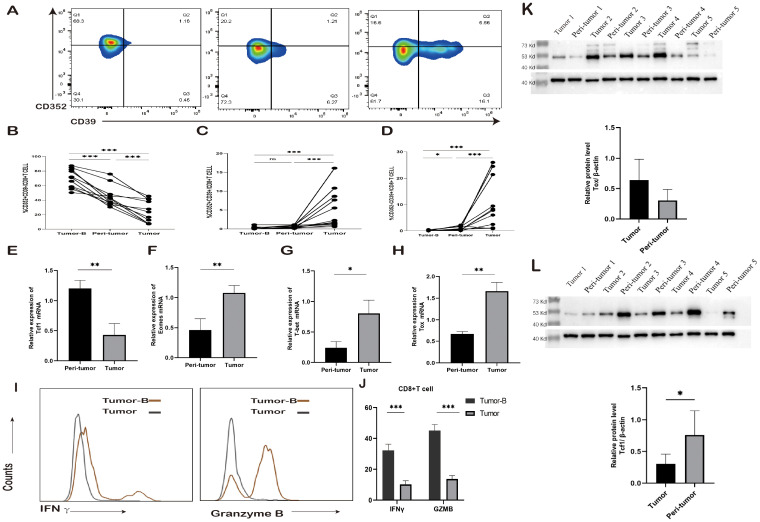
Changes in exhausted CD8+ T cell subsets. (A) Typical staining and expression frequency of CD352 and CD39 on CD8+ T cells in the Tumor-B, peri-tumor, and Tumor groups of the same lung cancer patients. Horizontal lines represent mean values. (B-D) Comparison of the expression frequency of CD352 and CD39 in CD8+ T cells in the Tumor-B, peri-tumor, and Tumor groups of the same lung cancer patients. (E) The mRNA expression level of Tcf1 in the peri-tumor and Tumor groups. (F) The mRNA expression level of Emoes in the peri-tumor and Tumor groups. (G) The mRNA expression level of T-bet in the peri-tumor and Tumor groups. (H) The mRNA expression level of Tox in the peri-tumor and Tumor groups. (I) Typical staining of CD8+ T cells producing IFN-γ and GZMB in the Tumor-B and Tumor groups. (J) Comparison of the frequency of IFN-γ and GZMB production by CD8+ T cells in the Tumor-B and Tumor groups. (K)The protein expression level of Tcf1 in the peri-tumor and Tumor groups. (L) The protein expression level of Tox in the peri-tumor and Tumor groups. The Tumor-B group was the peripheral blood PBMC group of patients with non-small cell lung cancer. The peri-tumor and Tumor groups were the paracancerous tissue group and cancer tissue group of patients with non-small cell lung cancer, respectively. ns, not statistically significant. *P < 0.05, **P < 0.01, ***P < 0.001.

Acknowledgments
This image is the copyrighted work of the attributed author or publisher, and ZFIN has permission only to display this image to its users. Additional permissions should be obtained from the applicable author or publisher of the image. Full text @ Front Immunol