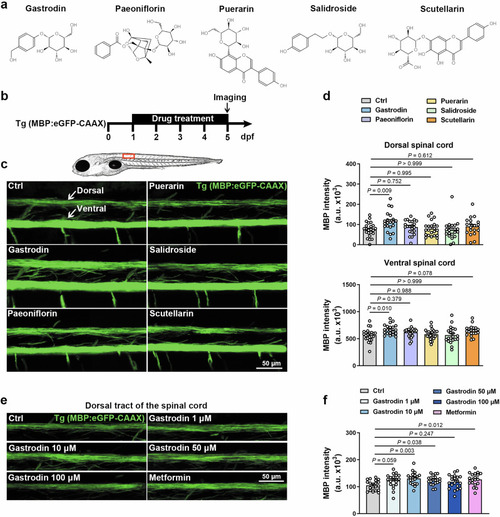
Drug screening in zebrafish identifies gastrodin as a pro-myelinating agent.

a Chemical structure of the TCM monomers (from ChemicalBook). b Schematic of drug screen pipeline. c Representative images depicting lateral view of the spinal cord in Tg(MBP:eGFP-CAAX) line at 5 dpf. Red box: location of zoomed-in example region (around 8–11 somites). d Mean fluorescence intensity of eGFP fluorescent intensity in the dorsal (above) and ventral (below) tracts of the spinal cord (n = 19–23 zebrafish). e Representative images depicting the dorsal tracts of the spinal cord in Tg(MBP:eGFP-CAAX) line at 5 dpf. Metformin serves as positive controls. f Mean fluorescence intensity of eGFP fluorescent intensity in the dorsal tracts of the spinal cord (n = 20 zebrafish). Data are represented as mean ± SEM, One-way ANOVA and Dunnett-t in d and f.

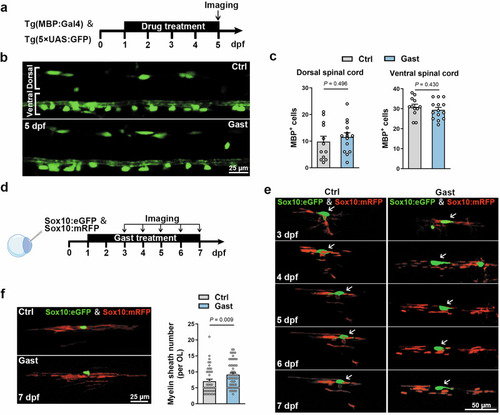
Gastrodin promotes myelin sheath formation.

a Schematic of Tg(MBP:Gal4) & Tg(5×UAS:GFP) imaging pipeline. b Representative images showing lateral views of the spinal cords at 5 dpf. c Quantification of GFP+ cells number in the ventral or dorsal spinal cord (n = 12–14 zebrafish). d Schematic of DNA microinjection and imaging pipeline. e Time-lapse imaging of myelin sheath development of a single OL from 3 dpf to 7 dpf. f Representative images showing myelin sheaths formed by a single OL at 7 dpf and quantification of myelin sheath number per OL (n = 42–60 OLs). Data are represented as mean ± SEM, unpaired Student’s t test in c and f.

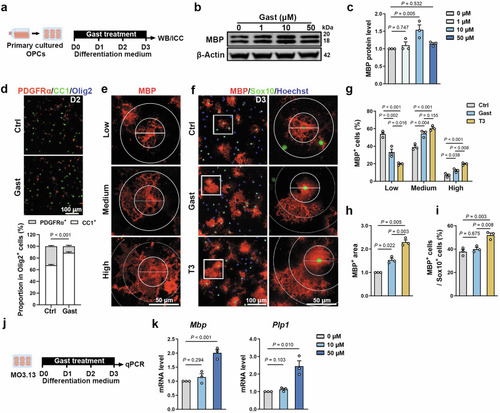
Gastrodin promotes OL maturation in vitro.

a Schematic depicting OPCs culture and gastrodin treatment. b Western blot for MBP after 1, 10, 50 μM gastrodin treatment. c Quantification of relative MBP protein levels (n = 3 experiments). d Representative images of PDGFRα (red), CC1 (green), and Olig2 (blue) immunofluorescence and quantification of proportion of CC1+ cells or PDGFRα+ cells in Olig2+ cells (n = 3 experiments). e Representative images of OLs membrane area of MBP+ cells, depicting different degrees of OL maturation. Low differentiation, OLs without membrane; Medium differentiation, OLs with a few membranes; High differentiation, OLs with large area of membrane. f Representative images of MBP (red) and Sox10 (green) immunofluorescence. White boxes zoom in are shown on the right. g Quantification of MBP+ cells’ proportion in different maturation degrees (n = 3 experiments). h Quantification of MBP+ area (n = 3 experiments). i Quantification of proportion of MBP+ cells in Sox10+ cells (n = 3 experiments). j Schematic depicting MO3.13 oligodendroglial cell line culture and gastrodin treatment. k qPCR analysis of Mbp and Plp1 after 10 and 50 μM gastrodin treatment (n = 3 experiments). Data are represented as mean ± SEM, One-way ANOVA and Dunnett-t in c, unpaired Student’s t test in d, gi, and k.

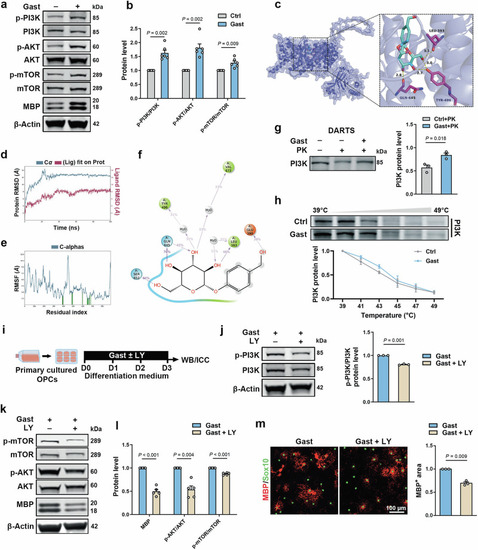
Gastrodin activates PI3K/AKT/mTOR signaling pathway in OLs.

a Western blot for p-PI3K, PI3K, p-AKT, AKT, p-mTOR, mTOR and MBP. b Quantification of the ratio of p-PI3K/PI3K, p-AKT/AKT, and p-mTOR/mTOR (n = 6 experiments). c The predicted binding model of gastrodin-PI3K complex by molecular docking. d Molecular dynamic simulation showing the plot of RMSD (in ångstrom) of the complex during 100 ns MD simulation. e RMSF values of PI3K during molecular dynamic simulations. Protein residues that interact with the ligand are marked with green-colored vertical bars. f A schematic of detailed ligand atom interactions with the protein residues. Interactions that occur for more than 30.0% of the simulation time in the selected trajectory (0.00 to 100.00 ns) are shown. g Western blot and quantification of relative PI3K protein levels (n = 3 experiments). Cell lysis was incubated with gastrodin and then subjected to proteinase K (PK). h Cellular Thermal Shift Assay, effect of gastrodin on the thermal stability of PI3K and quantification of relative PI3K protein levels (n = 3 experiments). i Schematic depicting OPCs culture with gastrodin and LY294002 (LY) treatment. j Western blot for p-PI3K and PI3K and quantification of the ratio of p-PI3K/PI3K (n = 3 experiments). k Western blot for p-mTOR, mTOR, p-AKT, AKT, and MBP. l Quantification of relative MBP protein levels and the ratio of p-mTOR/mTOR and p-AKT/AKT (n = 5 experiments). m Left: Representative images of MBP (red) and Sox10 (green) immunofluorescence. Right: Quantification of MBP+ area (n = 3 experiments). Data are represented as mean ± SEM, unpaired Student’s t test in b, g, j, l, and m.

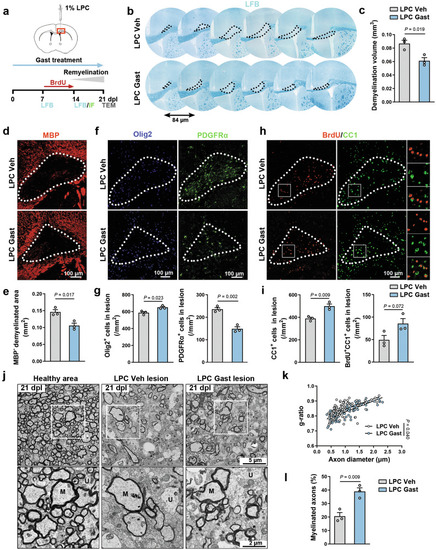
Gastrodin promotes remyelination after LPC-induced demyelination.

a Schematic depicting LPC-induced demyelination model. b LFB staining showing the serial demyelinating region in the corpus callosum. Lesions are shown in the black dotted line. c Quantification of the demyelination volume at 14 dpl (n = 3 mice). d Representative images of MBP (red) in the core lesion. Lesions are shown in the white dotted line. e Quantification of MBP- demyelinated area (n = 3 mice). f Representative images of Olig2 (blue) and PDGFRα (green) in the core lesion at 14 dpl. Lesions are shown in the white dotted line. g Quantification of Olig2+ cells/mm2 and PDGFRα+ cells/mm2 in the core lesion (n = 3 mice). h Representative images of BrdU (red) and CC1 (green) immunofluorescence in the core lesion at 14 dpl. Lesions are shown in the white dotted line, and white boxes zoom in are shown on the right. i Quantification of CC1+ cells/mm2 and BrdU+CC1+ cells/mm2 in the core lesion (n = 3 mice). j TEM images of the LPC-lesioned corpus callosum at 21 dpl. White boxes zoom in are shown below. M Myelinated axon, U Unmyelinated axon. k, l Quantification of g-ratio and proportion of myelinated axons in the LPC-lesioned corpus callosum at 21 dpl (n = 3 mice). Data are presented as mean ± SEM, unpaired Student’s t test in c, e, g, i, k, and l.

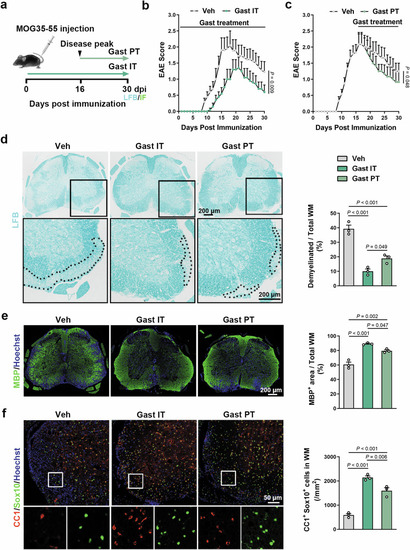
Gastrodin treatment effectively enhances remyelination in EAE mice.

a Schematic depicting EAE model and gastrodin treatment (gastrodin setting, 100 mg/kg ip). IT: initial treatment, PT: Peak treatment. b, c Clinical score in EAE mice treated at 1 dpi (left) or treated at disease peak (right) with gastrodin or vehicle (n = 6–10 mice). d LFB staining of spinal cord sections at 30 dpi (left) and quantification of the demyelinated white matter’s percentage (right, n = 3 mice). Black boxes zoom in are shown below. e Representative images of MBP (green) immunofluorescence in spinal cord sections at 30 dpi (left) and quantification of MBP+ area’s percentage (right, n = 3 mice). f Representative images of CC1 (red) and Sox10 (green) immunofluorescence around lesions at 30 dpi (left), and quantification of CC1+Sox10+ cells/mm2 (right, n = 3 mice). White boxes zoom in are shown below. Data are represented as mean ± SEM, Mann–Whitney U in b and c, one-way ANOVA with Tukey in df.

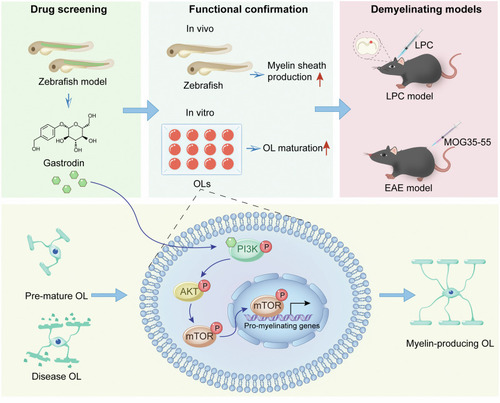
Schematic illustration of drug screening and pro-myelinogenesis effect of gastrodin via PI3K/AKT/mTOR signaling pathway.

Acknowledgments
This image is the copyrighted work of the attributed author or publisher, and ZFIN has permission only to display this image to its users. Additional permissions should be obtained from the applicable author or publisher of the image. Full text @ Acta Pharmacol. Sin.