|
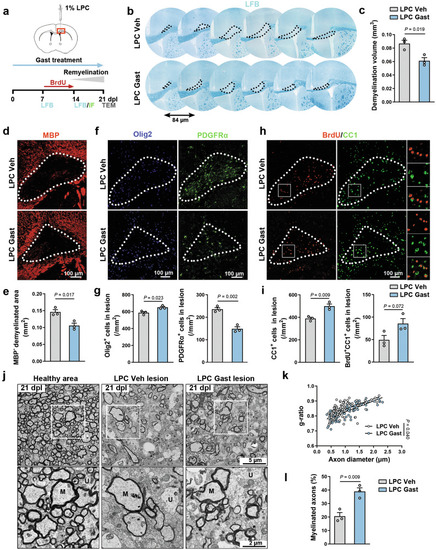
Gastrodin promotes remyelination after LPC-induced demyelination. a Schematic depicting LPC-induced demyelination model. b LFB staining showing the serial demyelinating region in the corpus callosum. Lesions are shown in the black dotted line. c Quantification of the demyelination volume at 14 dpl (n = 3 mice). d Representative images of MBP (red) in the core lesion. Lesions are shown in the white dotted line. e Quantification of MBP- demyelinated area (n = 3 mice). f Representative images of Olig2 (blue) and PDGFRα (green) in the core lesion at 14 dpl. Lesions are shown in the white dotted line. g Quantification of Olig2+ cells/mm2 and PDGFRα+ cells/mm2 in the core lesion (n = 3 mice). h Representative images of BrdU (red) and CC1 (green) immunofluorescence in the core lesion at 14 dpl. Lesions are shown in the white dotted line, and white boxes zoom in are shown on the right. i Quantification of CC1+ cells/mm2 and BrdU+CC1+ cells/mm2 in the core lesion (n = 3 mice). j TEM images of the LPC-lesioned corpus callosum at 21 dpl. White boxes zoom in are shown below. M Myelinated axon, U Unmyelinated axon. k, l Quantification of g-ratio and proportion of myelinated axons in the LPC-lesioned corpus callosum at 21 dpl (n = 3 mice). Data are presented as mean ± SEM, unpaired Student’s t test in c, e, g, i, k, and l.
|