IMAGE

Fig. 6

ID
ZDB-IMAGE-250526-65
Source
Figures for Shi et al., 2025
Image
Figure Caption

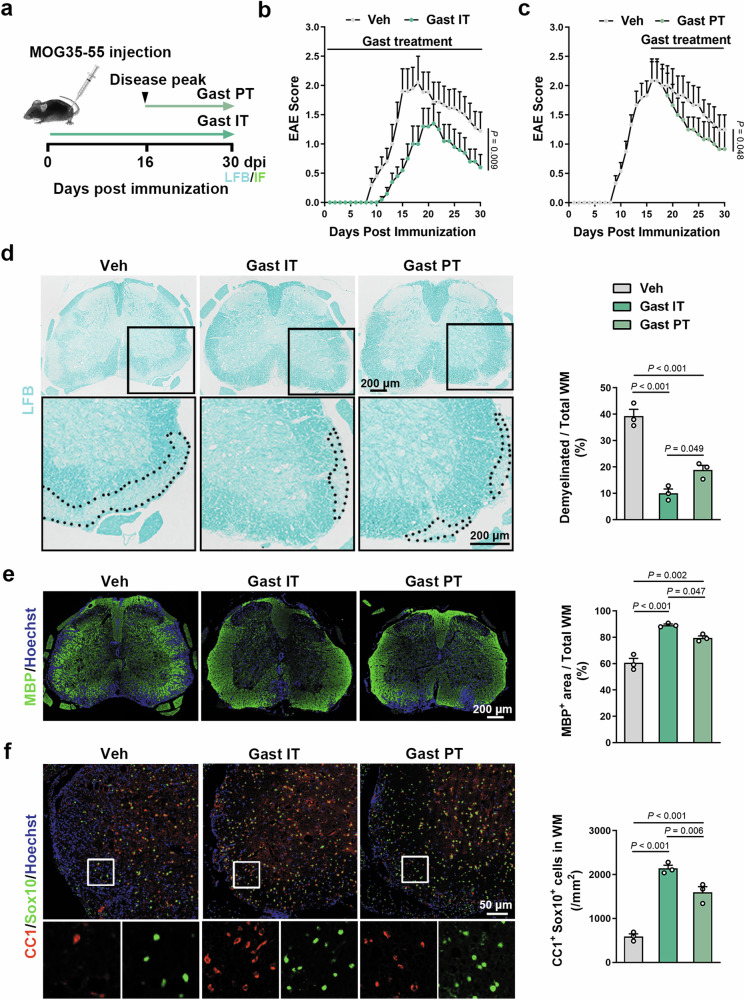
Fig. 6 Gastrodin treatment effectively enhances remyelination in EAE mice.

a Schematic depicting EAE model and gastrodin treatment (gastrodin setting, 100 mg/kg ip). IT: initial treatment, PT: Peak treatment. b, c Clinical score in EAE mice treated at 1 dpi (left) or treated at disease peak (right) with gastrodin or vehicle (n = 6–10 mice). d LFB staining of spinal cord sections at 30 dpi (left) and quantification of the demyelinated white matter’s percentage (right, n = 3 mice). Black boxes zoom in are shown below. e Representative images of MBP (green) immunofluorescence in spinal cord sections at 30 dpi (left) and quantification of MBP+ area’s percentage (right, n = 3 mice). f Representative images of CC1 (red) and Sox10 (green) immunofluorescence around lesions at 30 dpi (left), and quantification of CC1+Sox10+ cells/mm2 (right, n = 3 mice). White boxes zoom in are shown below. Data are represented as mean ± SEM, Mann–Whitney U in b and c, one-way ANOVA with Tukey in df.

Acknowledgments
This image is the copyrighted work of the attributed author or publisher, and ZFIN has permission only to display this image to its users. Additional permissions should be obtained from the applicable author or publisher of the image. Full text @ Acta Pharmacol. Sin.