|
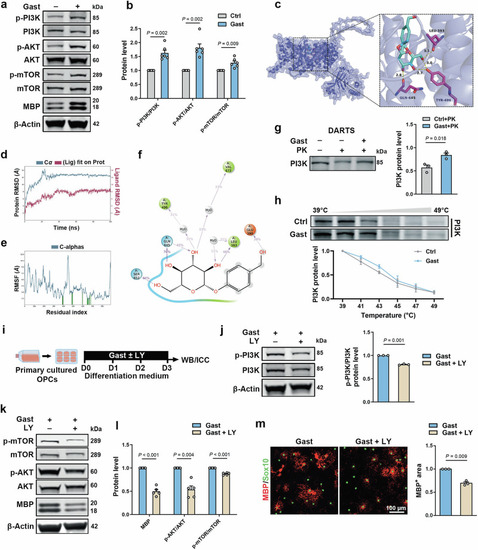
Gastrodin activates PI3K/AKT/mTOR signaling pathway in OLs. a Western blot for p-PI3K, PI3K, p-AKT, AKT, p-mTOR, mTOR and MBP. b Quantification of the ratio of p-PI3K/PI3K, p-AKT/AKT, and p-mTOR/mTOR (n = 6 experiments). c The predicted binding model of gastrodin-PI3K complex by molecular docking. d Molecular dynamic simulation showing the plot of RMSD (in ångstrom) of the complex during 100 ns MD simulation. e RMSF values of PI3K during molecular dynamic simulations. Protein residues that interact with the ligand are marked with green-colored vertical bars. f A schematic of detailed ligand atom interactions with the protein residues. Interactions that occur for more than 30.0% of the simulation time in the selected trajectory (0.00 to 100.00 ns) are shown. g Western blot and quantification of relative PI3K protein levels (n = 3 experiments). Cell lysis was incubated with gastrodin and then subjected to proteinase K (PK). h Cellular Thermal Shift Assay, effect of gastrodin on the thermal stability of PI3K and quantification of relative PI3K protein levels (n = 3 experiments). i Schematic depicting OPCs culture with gastrodin and LY294002 (LY) treatment. j Western blot for p-PI3K and PI3K and quantification of the ratio of p-PI3K/PI3K (n = 3 experiments). k Western blot for p-mTOR, mTOR, p-AKT, AKT, and MBP. l Quantification of relative MBP protein levels and the ratio of p-mTOR/mTOR and p-AKT/AKT (n = 5 experiments). m Left: Representative images of MBP (red) and Sox10 (green) immunofluorescence. Right: Quantification of MBP+ area (n = 3 experiments). Data are represented as mean ± SEM, unpaired Student’s t test in b, g, j, l, and m.
|