|
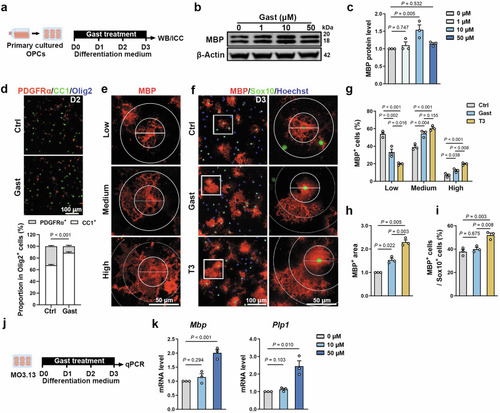
Gastrodin promotes OL maturation in vitro. a Schematic depicting OPCs culture and gastrodin treatment. b Western blot for MBP after 1, 10, 50 μM gastrodin treatment. c Quantification of relative MBP protein levels (n = 3 experiments). d Representative images of PDGFRα (red), CC1 (green), and Olig2 (blue) immunofluorescence and quantification of proportion of CC1+ cells or PDGFRα+ cells in Olig2+ cells (n = 3 experiments). e Representative images of OLs membrane area of MBP+ cells, depicting different degrees of OL maturation. Low differentiation, OLs without membrane; Medium differentiation, OLs with a few membranes; High differentiation, OLs with large area of membrane. f Representative images of MBP (red) and Sox10 (green) immunofluorescence. White boxes zoom in are shown on the right. g Quantification of MBP+ cells’ proportion in different maturation degrees (n = 3 experiments). h Quantification of MBP+ area (n = 3 experiments). i Quantification of proportion of MBP+ cells in Sox10+ cells (n = 3 experiments). j Schematic depicting MO3.13 oligodendroglial cell line culture and gastrodin treatment. k qPCR analysis of Mbp and Plp1 after 10 and 50 μM gastrodin treatment (n = 3 experiments). Data are represented as mean ± SEM, One-way ANOVA and Dunnett-t in c, unpaired Student’s t test in d, g–i, and k.
|