
- Title
-
Oxymatrine, a novel TLR2 agonist, promotes megakaryopoiesis and thrombopoiesis through the STING/NF-κB pathway
- Authors
- Ni, C., Zhou, L., Yang, S., Ran, M., Luo, J., Cheng, K., Huang, F., Tang, X., Xie, X., Qin, D., Mei, Q., Wang, L., Xiao, J., Wu, J.
- Source
- Full text @ J Pharm Anal
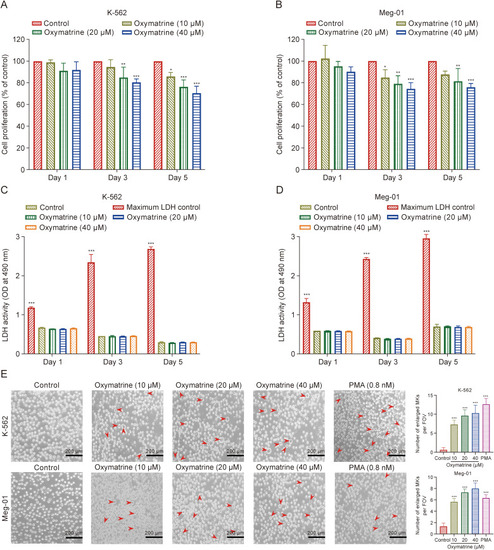
Screening safe concentrations of oxymatrine for the treatment of K-562 and Meg-01 megakaryocyte (MK). (A, B) The Cell Counting Kit-8 (CCK-8) assay for oxymatrine-treated K-562 (A) and Meg-01 (B) MK proliferation. Three different time points and drug concentrations were used to measure the cell proliferation rate (n = 6 per group). (C, D) Detection of lactate dehydrogenase (LDH) release of K-562 (C) and Meg-01 (D) cells treated with different drug concentrations and measured at different time points (n = 6 per group). (E) Representative images of oxymatrine intervened K-562 and Meg-01 cells with various concentration (10, 20, and 40 μM) for five days (n = 3 per group). Phorbol 12-myristate 13-acetate (PMA) was used as positive control (0.8 nM). Data represent the mean ± standard deviation (SD) of six or three independent experiments and are analyzed by one-way analysis of variance (ANOVA) with Dunnett's 154. ∗P < 0.05, ∗∗P < 0.01, and ∗∗∗P < 0.001 vs. the control. FOV: field of view. |
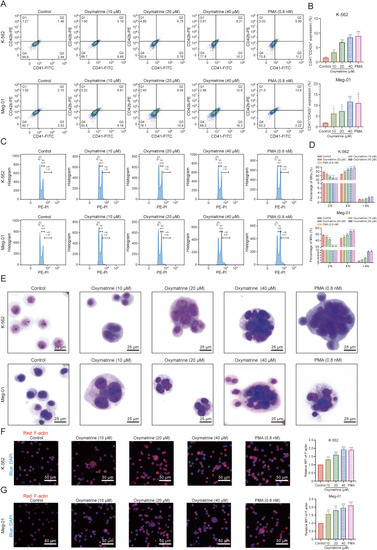
Oxymatrine promotes typical megakaryocyte (MK) differentiation in concentration-dependent manner. (A) Analysis of CD41+/CD42b+ complex surface expression of oxymatrine (10, 20, and 40 μM) and phorbol 12-myristate 13-acetate (PMA; 0.8 nM) intervened K-562 and Meg-01 cell for five days by flow cytometry. (B) The percentage of CD41+/CD42b+ cells in the control and oxymatrine-treated groups (n = 3 per group). (C) The DNA ploidy analysis of oxymatrine (10, 20, and 40 μM) and PMA (0.8 nM) induced K-562 and Meg-01 cell for five days by flow cytometry. (D) The histogram represents the proportion of total 2 N, 4 N and ≥4 N ploidy in both K-562 and Meg-01 cells (n = 3 per group). (E) Giemsa staining of K562 and Meg-01 cells with or without oxymatrine (10, 20, and 40 μM) treatment for five days (PMA (0.8 nM) as positive control). (F, G) Phalloidin-labeled cytospin in K562 (F) and Meg-01 (G) cells intervened with multiple concentrations of oxymatrine (10, 20, and 40 μM) for five days under a fluorescence microscope (n = 3 per group). Excitation wavelength: 560 nm for phalloidin and 405 nm for 4′,6-diamidino-2-phenylindole (DAPI). Data represent the mean ± standard deviation (SD) of three independent experiments and are analyzed by one-way analysis of variance (ANOVA) with Dunnett's 154. ∗P < 0.05, ∗∗P < 0.01, and ∗∗∗P < 0.001 vs. the control. FITC: fluorescein isothiocyanate; PE: phycoerythrin; PI: propidium iodide; MFI: mean fluorescence intensity. |

Oxymatrine administration promotes thrombopoiesis in Tg (cd41:enhanced green fluorescent protein (eGFP)) transgenic zebrafish. (A) Cd41:eGFP+ thrombocytes in the caudal hematopoietic tissue (CHT) region of oxymatrine (10, 20, and 40 μM) treated and control zebrafish. (B) Quantification of cd41:eGFP+ cells in the CHT region in each group (n = 4 per group). (C) Flow cytometry analysis of cd41:eGFP+ cells in zebrafish embryos. (D) Quantification of cd41:eGFP+ cells in the zebrafish embryos in each group (n = 3 per group). Data represent the mean ± standard deviation (SD) of four or three independent experiments and are analyzed by one-way analysis of variance (ANOVA) with Dunnett's 154. ∗∗P < 0.01 and ∗∗∗P < 0.001 vs. the control. SSC: side scatter; FITC: fluorescein isothiocyanate |
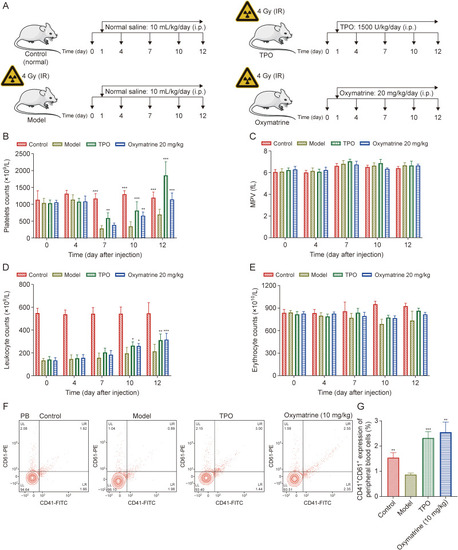
Oxymatrine accelerates platelet recovery in acute X-ray irradiated mice. (A) The strategies of establishing the irradiated mice and treatment of each groups. (B) Peripheral platelet level of control group, thrombopoietin (TPO)-treated group (3000 U/kg), oxymatrine-treated group (20 mg/kg), and model group. Histology analysis was performed on days 0, 4, 7, 10, and 12 (n = 6 per group). (C) Mean platelet volume (MPV) values in each groups (n = 6 per group). (D) Leukocyte counts in each group (n = 6 per group). (E) Erythrocyte counts in each group (n = 6 per group). (F) Flow cytometry analysis of expression of CD41 and CD61 in peripheral blood (PB) platelets in each group after treatment for 12 days. (G) The histogram exhibits the percentage of expression of CD41+/CD61+ in PB cells in each group (n = 3 per group). Data represent the mean ± standard deviation (SD). Two-way analysis of variance (ANOVA) with Tukey's multiple comparisons test was used unless otherwise specified. ∗P < 0.05, ∗∗P < 0.01, and ∗∗∗P < 0.001 vs. the corresponding model group. IR: ionizing radiation; FITC: fluorescein isothiocyanate; UL: upper left; UR: upper right; LL: lower left; LR: lower right. |

Oxymatrine rescues megakaryopoiesis in the bone marrow (BM) and spleen after acute radiation injury. (A) Representative images of hematoxylin and eosin (H&E) staining of BM from control group, model group, thrombopoietin (TPO)-treated (3000 U/kg) group, and oxymatrine-treated (20 mg/kg) group after treatment for 12 days. (B) The histogram exhibits the counts of BM megakaryocyte (MK) in each group (n = 3 per group). (C) Representative images of H&E staining of spleens from each group after treatment for 12 days. (D) The histogram shows the counts of spleen MKs in each group (n = 3 per group). (E) The analysis of c-Kit+/CD41− (hematopoietic progenitor cells), c-Kit+/CD41+ (megakaryocytic progenitor cells), and c-Kit-/CD41+ (MKs) cell expression in each group after treatment for 12 days performed by flow cytometry. (F) The histogram exhibits the percentage of c-Kit+/CD41−, c-Kit+/CD41+, and c-Kit-/CD41+ cells in each group (n = 3 per group). (G) The expression of CD61 and CD41 in both BM MKs and spleen MKs was detected by flow cytometry after treatment for 12 days. (H) The histogram shows the percentage of CD41+/CD61+ cells in BM MKs of each groups (n = 3 per group). (I) The histogram shows the percentage of CD41+/CD61+ cells in spleen MKs of each group (n = 3 per group). Data represent the mean ± standard deviation (SD) of three independent experiments. ∗P < 0.05, ∗∗P < 0.01, and ∗∗∗P < 0.001 vs. the model group. PE: phycoerythrin; FITC: fluorescein isothiocyanate; UL: upper left; UR: upper right; LL: lower left; LR: lower right |
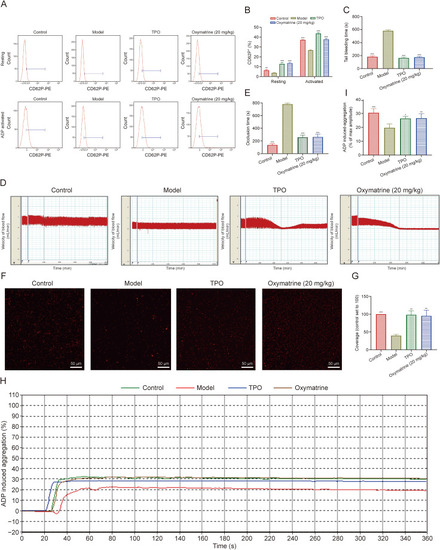
Oxymatrine accelerates the recovery of platelet function in irradiated mice. (A) Flow cytometry analysis of CD62P+ cells in washed platelets in control, model, thrombopoietin (TPO)-treated, and oxymatrine-treated groups (top), and the activated (adenosine diphosphate (ADP) 10 μM) CD62P+ cells in each group (bottom). (B) The histogram shows the percentage of CD62P+cells with or without ADP (10 μM) activation (n = 3 per group). (C) Tail bleeding time of each group after treatment of 12 days (n = 3 per group). (D) Analysis of carotid blood flow detection of each group. (E) The mean carotid artery occlusion times are represented by the histogram (n = 3 per group). (F) Micrographs of collagen-coated slides with the same number of platelets perfused. Red represents platelets. (G) The histogram shows the average coverage of red fluorescence on the whole surface by ImageJ software (n = 3 per group). (H) Platelet aggregation was detected under the activation of ADP by the device of turbidimetric aggregation-monitoring. (I) The histogram showed the maximum aggregation amplitude of platelets in each group (n = 3 per group). Data represent the mean ± standard deviation (SD) of three independent experiments. ∗P < 0.05, ∗∗P < 0.01, and ∗∗∗P < 0.001 vs. the model group. |
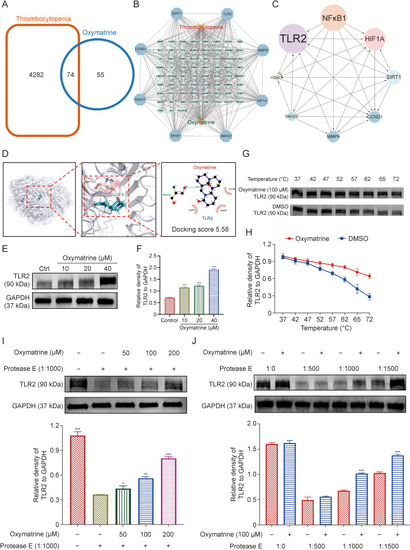
Oxymatrine targets toll-like receptor 2 (TLR2) to induce magakaryocyte (MK) differentiation and thrombopoiesis. (A) Venn diagram exhibiting the shared targets of oxymatrine and thrombocytopenia. (B) The interaction of the shared targets analyzed by the Cytoscape_v3.7.1 software. (C) Protein-protein interaction (PPI) network for identifying the core target of oxymatrine against thrombocytopenia. (D) The molecular docking model for TLR2 and ligands (oxymatrine). (E) After oxymatrine (10, 20, and 40 μM) intervened Meg-01 cells for five days, the representative immunoblot images and biochemical quantification of TLR2 were enhanced. (F) The histogram shows the relative density of TLR2 to glyceraldehyde-3-phosphate dehydrogenase (GAPDH) (n = 3 per group). (G) Cellular thermal shift assay (CETSA) analysis of TLR2 degradation damage under different temperatures. (H) The histogram shows the relative density of TLR2 to GAPDH (n = 3 per group). (I) The drug affinity responsive target stability assay (DARTS) assay indicated oxymatrine blinding to the TLR2 in a concentration-dependent manner. Treatment with protease (1:1000) was conducted for 10 min at 40 °C (n = 3 per group). (J) DARTS assay for target validation. The stability of protein TLR2 was enhanced upon the treatment of oxymatrine (100 μM) in Meg-01 lysates. Concentration gradient (1:500, 1:1000, and 1:1500) protease was added for 60 μg/mL stock for 10 min at 40 °C (n = 3 per group). Data represent the mean ± standard deviation (SD) of three independent experiments. ∗P < 0.05, ∗∗P < 0.01, and ∗∗∗P < 0.001 vs. the control group. NFκB1: nuclear factor kappaB subunit 1; DMSO: dimethyl sulfoxide. |
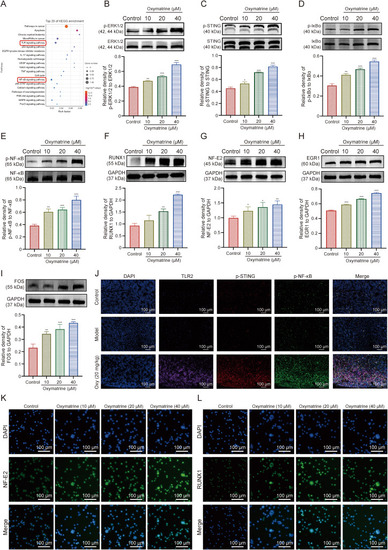
Oxymatrine induces megakaryocyte (MK) differentiation by activating stimulator of interferon genes (STING)/nuclear factor-kappaB (NF-κB) pathway. (A) Kyoto Encyclopedia of Genes and Genomes (KEGG) pathway enrichment analysis for the potential pathway by which oxymatrine promotes MK differentiation. (B–E) Western blot (WB) analysis of the expression of pathway: extracellular regulated kinase 1/2 (ERK1/2)/STING/inhibitory subunit of nuclear factor kappa B alpha (IκBα)/NF-κB by which oxymatrine promotes MK differentiation. Representative immunoblot images and biochemical quantification of the ERK1/2 (B), STING (C), IκBα (D), and NF-κB (E) pathway after the treatment with oxymatrine (10, 20, and 40 μM) in Meg-01 cells for five days (n = 3 per group). (F–I) Representative immunoblot images and biochemical quantification of the transcription factors (TFs) associated with MK differentiation: runt-related transcription factor 1 (RUNX1) (F), nuclear factor erythroid 2 (NF-E2) (G), early growth response protein 1 (EGR1) (H), and cellular oncogene fos (FOS) (I) (n = 3 per group). (J) Representative immunofluorescence images of toll-like receptor 2 (TLR2) fluorescently triple-stained with p-STING and p-NF-κB, respectively, on bone marrow (BM) cells after 12 days of treatment with oxymatrine in a mouse model of radiation thrombocytopenia. Blue for the 4′,6-diamidino-2-phenylindole (DAPI), purple for the TLR2, red for the p-STING, and green for the p-NF-κB. (K, L) Representative images of immunofluorescence of the nuclear translocation of NF-E2 (K) and RUNX1 (L) in Meg-01 cells after the treatment of oxymatrine for five days. Excitation wavelengths: 470 nm for NF-E2 and RUNX1 and 405 nm for DAPI. Data represent the mean ± standard deviation (SD) of three independent experiments. ∗P < 0.05, ∗∗P < 0.01, and ∗∗∗P < 0.001 vs. the control group. EGFR: epidermal growth factor receptor; IL-17: interleukin 17; VEGF: vascular endothelial growth factor; TNF: tumor necrosis factor; JAK-STAT: janus kinase-signal transducer and activator of transcription; PI3K-Akt: phospholnositide-3 kinase-threonine kinase B; MAPK: mitogen-activated protein kinase; FoxO: forkhead box protein O; GAPDH: glyceraldehyde-3-phosphate dehydrogenase. |

The effect of megakaryocyte (MK) differentiation induced by oxymatrine was block by toll-like receptor 2 (TLR2) inhibitor C29 and stimulator of interferon genes (STING) inhibitor C-176. (A) Representative images of oxymatrine treated Meg-01 cells with oxymatrine (40 μM), C29 (50 μM), oxymatrine (40 μM) + C29 (50 μM), C-176 (10 μM), and oxymatrine (40 μM) + C-176 (10 μM) for five days. (B) The histogram represents the number of MKs in each group (n = 3 per group). (C) Phalloidin-labeled cytospin in Meg-01 cells intervened with oxymatrine (40 μM), C29 (50 μM), oxymatrine (40 μM) + C29 (50 μM), C-176 (10 μM), and oxymatrine (40 μM) + C-176 (10 μM) for five days under a fluorescence Microscope. Excitation wavelength: 560 nm for phalloidin and 405 nm for 4′,6-diamidino-2-phenylindole (DAPI). (D) The histogram represents the relative mean fluorescence intensity (MFI) of F-actin in each group (n = 3 per group). (E) Flow cytometry analysis exhibits the percentage of CD41+/CD42+ cells after the treatment of oxymatrine (40 μM), C29 (50 μM), oxymatrine (40 μM) + C29 (50 μM), C-176 (10 μM), and oxymatrine (40 μM) + C-176 (10 μM) for five days. (F) The histogram represents the percentage of CD41+/CD42b+ expression in each group (n = 3 per group). (G–J) Representative immunoblot images (G) and biochemical quantification of TLR2 (H), STING (I), and nuclear factor-kappaB (NF-κB) (J) after the treatment of oxymatrine (40 μM), C29 (50 μM), and oxymatrine (40 μM) + C29 (50 μM) for five days (n = 3 per group). (K–N) Representative immunoblot images (K) and biochemical quantification of TLR2 (L), STING (M), and NF-κB (N) after the treatment of oxymatrine (40 μM), C-176 (10 μM), and oxymatrine (40 μM) + C-176 (10 μM) for five days (n = 3 per group). Data represent the mean ± standard deviation (SD) of three independent experiments. ∗P < 0.05, ∗∗P < 0.01, and ∗∗∗P < 0.001 vs. the oxymatrine group. ns: no significance. PE: phycoerythrin; FITC: fluorescein isothiocyanate; FOV: field of view; GAPDH: glyceraldehyde-3-phosphate dehydrogenase. |
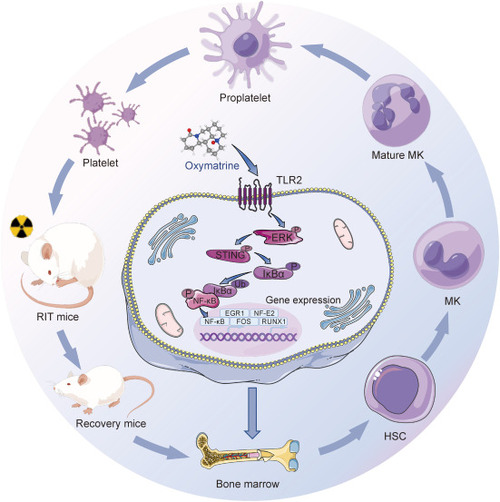
The schematic illustration of oxymatrine regulating megakaryocyte (MK) differentiation and thrombopoiesis. Oxymatrine targets toll-like receptor 2 (TLR2) and activates the downstream extracellular regulated kinase 1/2 (ERK1/2)/stimulator of interferon genes (STING)/inhibitory subunit of nuclear factor kappa B alpha (IκBα)/nuclear factor-kappaB (NF-κB) signaling pathway, which leads to the high expression of transcription factors (TFs): early growth response 1 (EGR1), nuclear factor erythroid 2 (NF-E2), cellular oncogene fos (FOS), and runt-related transcription factor 1 (RUNX1). As a result, the activated transcription factors promote the expression of megakaryopoiesis and thrombopoiesis related genes, which contribute to the MK maturation and platelet production and finally recover the platelet levels in adiation-induced thrombocytopenia mice. RIT: radiation-induced thrombocytopenia; HSC: hematopoietic stem cell; ERK: extracellular regulated kinase; Ub: ubiquitin. |