
|
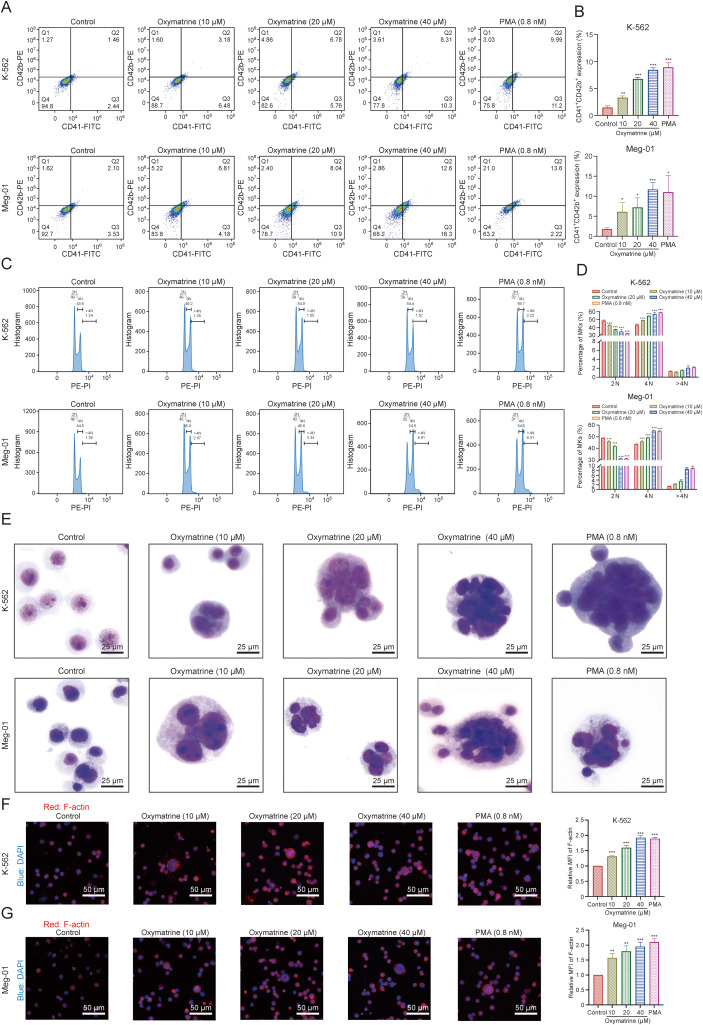
Fig. 2 Oxymatrine promotes typical megakaryocyte (MK) differentiation in concentration-dependent manner. (A) Analysis of CD41+/CD42b+ complex surface expression of oxymatrine (10, 20, and 40 μM) and phorbol 12-myristate 13-acetate (PMA; 0.8 nM) intervened K-562 and Meg-01 cell for five days by flow cytometry. (B) The percentage of CD41+/CD42b+ cells in the control and oxymatrine-treated groups (n = 3 per group). (C) The DNA ploidy analysis of oxymatrine (10, 20, and 40 μM) and PMA (0.8 nM) induced K-562 and Meg-01 cell for five days by flow cytometry. (D) The histogram represents the proportion of total 2 N, 4 N and ≥4 N ploidy in both K-562 and Meg-01 cells (n = 3 per group). (E) Giemsa staining of K562 and Meg-01 cells with or without oxymatrine (10, 20, and 40 μM) treatment for five days (PMA (0.8 nM) as positive control). (F, G) Phalloidin-labeled cytospin in K562 (F) and Meg-01 (G) cells intervened with multiple concentrations of oxymatrine (10, 20, and 40 μM) for five days under a fluorescence microscope (n = 3 per group). Excitation wavelength: 560 nm for phalloidin and 405 nm for 4′,6-diamidino-2-phenylindole (DAPI). Data represent the mean ± standard deviation (SD) of three independent experiments and are analyzed by one-way analysis of variance (ANOVA) with Dunnett's 154. ∗P < 0.05, ∗∗P < 0.01, and ∗∗∗P < 0.001 vs. the control. FITC: fluorescein isothiocyanate; PE: phycoerythrin; PI: propidium iodide; MFI: mean fluorescence intensity.