
- Title
-
Activation of Wnt/β-catenin in neural progenitor cells regulates blood-brain barrier development and promotes neuroinflammation
- Authors
- Sebo, D.J., Ali, I., Fetsko, A.R., Trimbach, A.A., Taylor, M.R.
- Source
- Full text @ Sci. Rep.
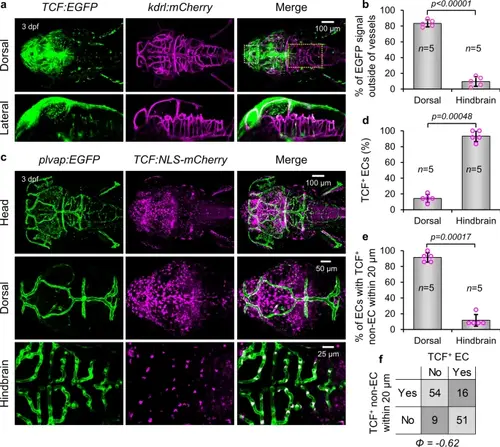
Inverse correlation between Wnt/β-catenin signaling in endothelial cells and adjacent non-endothelial cells. (a) Dorsal and lateral views of TCF: EGFP; kdrl:mCherry larvae at 3 dpf showing localization of Wnt/β-catenin signaling with respect to vasculature. Dotted outlines demarcate dorsal (white) and hindbrain (yellow) regions used for quantification. (b) Percentage of TCF: EGFP fluorescence signal localized outside of vessel boundaries in the dorsal surface vessels and the hindbrain. p-value was calculated using the parametric two-tailed T-test. (c) Dorsal views of plvap:EGFP, TCF:NLS-mCherry larvae and representative cropped dorsal surface vessel and hindbrain regions of interest used for quantification. (d) Percentage of endothelial cells in larvae from (c) that are TCF+ in dorsal and hindbrain regions of interest. (e) Percentage of endothelial cells in larvae from (c) which had ≥ 1 TCF+ non-endothelial cell within 20 μm in dorsal surface and hindbrain regions of interest. p-values of categorical data in (d, e) were calculated using the Fishers Exact Test. Data are shown as mean ± standard deviation. (f) Contingency square representation of all endothelial cells analyzed in (d, e) used to calculate phi coefficient. |
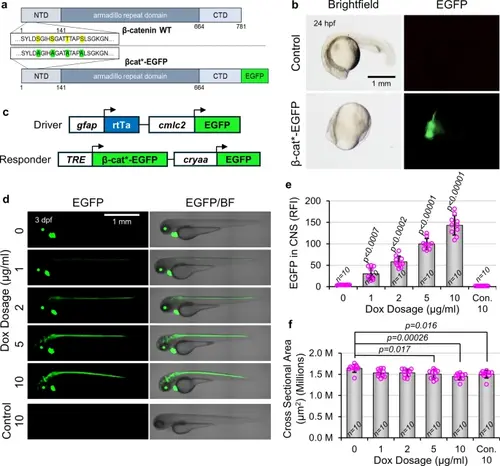
Generation of Dox-inducible transgenic lines to activate Wnt/β-catenin signaling in NPCs. (a) Schematic representation of endogenous β-catenin (β-catenin WT) and engineered constitutively active β-catenin fused to EGFP (β-cat*-EGFP). Serine and threonine residues S33, S37, T41, and S45 (yellow) were mutated to alanine (green), and EGFP was added in frame to the C terminus. (b) β-cat*-EGFP mRNA was synthesized and injected into single-cell embryos. At 24 hpf, injected embryos are dorsalized (no tail) and express EGFP. (c) Schematic of DNA constructs used to make the Tg(gfap:rtTA, cmlc2:EGFP) driver line and Tg(TRE:β-cat*-EGFP, cryaa:EGFP) responder line. Driver and responder lines are distinguished by green hearts (cmlc2:EGFP) or green lenses (cryaa:EGFP), respectively. (d) Representative lateral images of 3 dpf transgenic gfap;rtTA, TRE:β-cat*-EGFP larvae, or wild type siblings (Con.), treated with indicated Dox concentrations. (e) Quantification of EGFP fluorescence intensity within the CNS of larvae shown in (d) (n = 10 for all conditions). (f) Quantification of whole animal cross sectional area of larvae shown in (d) (n = 10 for all conditions). p-values were calculated for comparisons of all groups using the parametric one-way analysis of variance (ANOVA) with Tukey HSD post hoc test (no label = not significant). p-values directly above a bar indicate significant difference to all other groups by at least the level shown. Data are shown as mean ± standard deviation. |
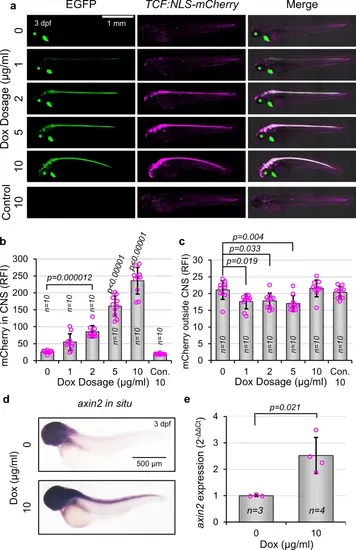
Expression of β-cat*-EGFP in NPCs promotes Wnt/β-catenin transcriptional activation. (a) Representative images of gfap:rtTA, TRE:β-cat*-EGFP, TCF:NLS-mCherry larvae or wild type siblings (Con.) at 3 dpf, treated with indicated Dox concentrations. (b, c) Quantification of mCherry fluorescence intensity within the CNS (b) and outside of the CNS (c) of larvae shown in (a) (n = 10 for all conditions). p-values were calculated for comparisons of all groups using the parametric one-way analysis of variance (ANOVA) with Tukey HSD post hoc test (no label = not significant). p-values directly above a bar indicate significant difference to all other groups by at least the level shown. Data are shown as mean ± standard deviation. (d) Representative lateral images of whole-mount in situ hybridization against axin2 transcript in gfap:rtTA, TRE:β-cat*-EGFP larvae at 3 dpf treated with indicated Dox concentrations (representative from n > 10 for all treatments). (e) Quantification of axin2 expression by qPCR. p-value was calculated using the parametric two-tailed t-test. Data are shown as mean ± standard deviation. |
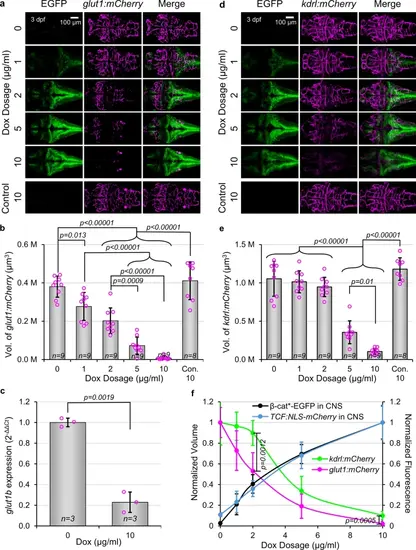
Activation of Wnt/β-catenin signaling in NPCs disrupts neurovascular development. (a) Representative dorsal images of gfap:rtTA, TRE:β-cat*-EGFP, glut1:mCherry larvae, or wild type siblings (Con.), treated with indicated Dox concentrations. (b) Quantification of mCherry fluorescence volume of larvae shown in (a). (c) Quantification of glut1b expression by qPCR. p-value was calculated using the parametric two-tailed t-test. Data are shown as mean ± standard deviation. (d) Representative dorsal images of gfap:rtTA, TRE:β-cat*-EGFP, kdrl:mCherry larvae, or wild type siblings (Con.), treated with indicated Dox concentrations. (e) Quantification of mCherry fluorescence volume of larvae shown in (d). p-values were calculated for comparisons of all groups using the parametric one-way analysis of variance (ANOVA) with Tukey HSD post hoc test (no label = not significant). Data are shown as mean ± standard deviation. (f) Normalization allowed for comparison of phenotypic dose dependency. Note the steeper slope of glut1:mCherry compared to kdrl:mCherry. p-values were calculated comparing glut1b:mCherry volume and kdrl:mCherry volume at each dosage using the non-parametric two-tailed Mann–Whitney Test. Data are shown as normalized mean ± standard deviation with smooth curve fit. |
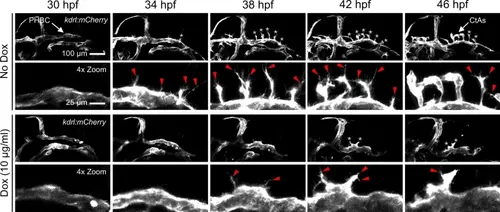
Activated Wnt/β-catenin signaling in NPCs decreases tip cell migration. Lateral still frames from time-lapse confocal microscopy of gfap:rtTA, TRE:β-cat*-EGFP larvae treated with indicated Dox concentrations. Snapshots are at 4-h intervals over 16 h of acquisition beginning at the onset of CNS angiogenesis (30 hpf). Magnified frames (4 × Zoom) highlight the hindbrain region bounded ventrally by the primordial hindbrain channels. Stereotypical tip cells are indicated by white asterisks. Stereotypical filipodia are indicated by red arrowheads. See supplementary videos 4, 5 for more detail. |
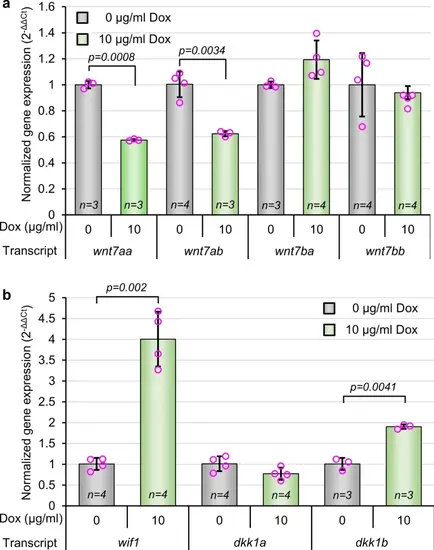
Activation of Wnt/β-catenin signaling in NPCs regulates the transcription of Wnt pathway activators and inhibitors. (a, b) Quantification of select wnt agonists (a) and wnt antagonists (b) by qPCR. Normalized expression levels were calculated using the delta delta Ct method using β-actin as a housekeeping gene. p-values were calculated between treated and control groups for each transcript using two-tailed t-tests. Data are shown as mean ± standard deviation. |
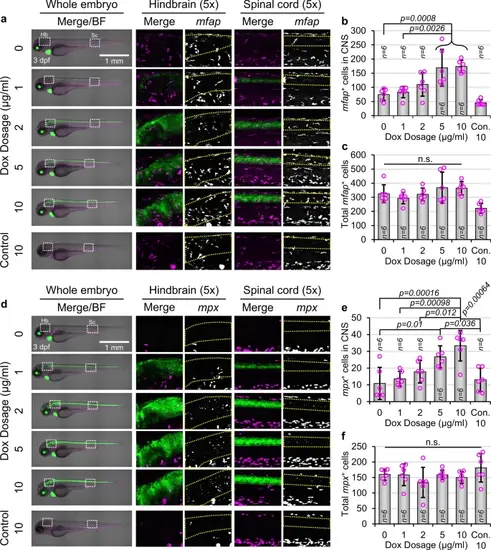
Activation of Wnt/β-catenin signaling in NPCs causes neuroinflammation. (a) Representative images of gfap:rtTA, TRE:β-cat*-EGFP, mfap:tdTomato larvae or wild type siblings (Con.) at 3 dpf, treated with indicated Dox concentrations. Magnified frames (5 × Zoom) highlight microglia/macrophages in the hindbrain (Hb) and spinal cord (Sc). The CNS is outlined by yellow dotted boxes. (b, c) Quantification of mfap+ cells within the CNS (b) and in the whole larva (c) of larvae shown in (a) (n = 6 for all conditions). p-values were calculated for comparisons of all groups using the parametric one-way analysis of variance (ANOVA) with Tukey HSD post hoc test (no label = not significant). Data are shown as mean ± standard deviation. (d) Representative lateral images of gfap:rtTA, TRE:β-cat*-EGFP, mpx:mCherry larvae or wild type siblings (Con.) at 3 dpf, treated with indicated Dox concentrations. Magnified frames (5 × Zoom) highlight neutrophils in the hindbrain (Hb) and spinal cord (Sc). The CNS is outlined by yellow dotted boxes. (e, f) Quantification of mpx+ cells within the CNS (e) and in the whole larva (f) of larvae shown in (d) (n = 6 for all conditions). p-values were calculated for comparisons of all groups using the parametric one-way analysis of variance (ANOVA) with Tukey HSD post hoc test (no label = not significant). Data are shown as mean ± standard deviation. |