
|
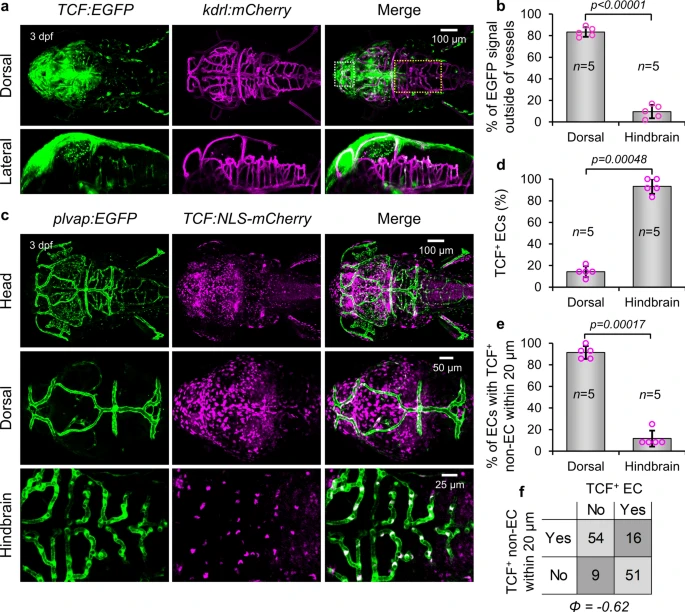
Fig. 1 Inverse correlation between Wnt/β-catenin signaling in endothelial cells and adjacent non-endothelial cells. (a) Dorsal and lateral views of TCF: EGFP; kdrl:mCherry larvae at 3 dpf showing localization of Wnt/β-catenin signaling with respect to vasculature. Dotted outlines demarcate dorsal (white) and hindbrain (yellow) regions used for quantification. (b) Percentage of TCF: EGFP fluorescence signal localized outside of vessel boundaries in the dorsal surface vessels and the hindbrain. p-value was calculated using the parametric two-tailed T-test. (c) Dorsal views of plvap:EGFP, TCF:NLS-mCherry larvae and representative cropped dorsal surface vessel and hindbrain regions of interest used for quantification. (d) Percentage of endothelial cells in larvae from (c) that are TCF+ in dorsal and hindbrain regions of interest. (e) Percentage of endothelial cells in larvae from (c) which had ≥ 1 TCF+ non-endothelial cell within 20 μm in dorsal surface and hindbrain regions of interest. p-values of categorical data in (d, e) were calculated using the Fishers Exact Test. Data are shown as mean ± standard deviation. (f) Contingency square representation of all endothelial cells analyzed in (d, e) used to calculate phi coefficient.