
Fig. 7
- ID
- ZDB-FIG-250304-27
- Publication
- Sebo et al., 2025 - Activation of Wnt/β-catenin in neural progenitor cells regulates blood-brain barrier development and promotes neuroinflammation
- Other Figures
- All Figure Page
- Back to All Figure Page
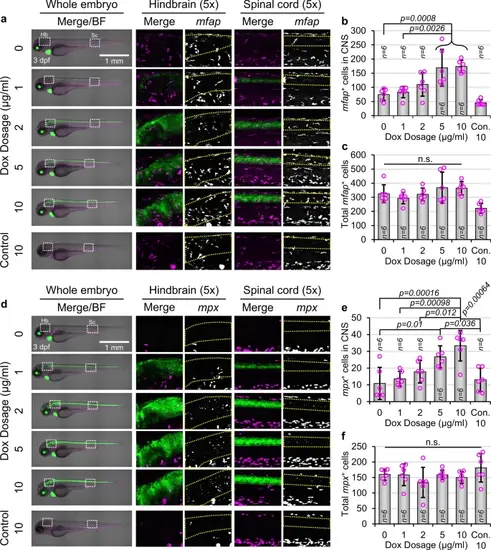
Activation of Wnt/β-catenin signaling in NPCs causes neuroinflammation. (a) Representative images of gfap:rtTA, TRE:β-cat*-EGFP, mfap:tdTomato larvae or wild type siblings (Con.) at 3 dpf, treated with indicated Dox concentrations. Magnified frames (5 × Zoom) highlight microglia/macrophages in the hindbrain (Hb) and spinal cord (Sc). The CNS is outlined by yellow dotted boxes. (b, c) Quantification of mfap+ cells within the CNS (b) and in the whole larva (c) of larvae shown in (a) (n = 6 for all conditions). p-values were calculated for comparisons of all groups using the parametric one-way analysis of variance (ANOVA) with Tukey HSD post hoc test (no label = not significant). Data are shown as mean ± standard deviation. (d) Representative lateral images of gfap:rtTA, TRE:β-cat*-EGFP, mpx:mCherry larvae or wild type siblings (Con.) at 3 dpf, treated with indicated Dox concentrations. Magnified frames (5 × Zoom) highlight neutrophils in the hindbrain (Hb) and spinal cord (Sc). The CNS is outlined by yellow dotted boxes. (e, f) Quantification of mpx+ cells within the CNS (e) and in the whole larva (f) of larvae shown in (d) (n = 6 for all conditions). p-values were calculated for comparisons of all groups using the parametric one-way analysis of variance (ANOVA) with Tukey HSD post hoc test (no label = not significant). Data are shown as mean ± standard deviation. |