
Fig. 4
- ID
- ZDB-FIG-250304-24
- Publication
- Sebo et al., 2025 - Activation of Wnt/β-catenin in neural progenitor cells regulates blood-brain barrier development and promotes neuroinflammation
- Other Figures
- All Figure Page
- Back to All Figure Page
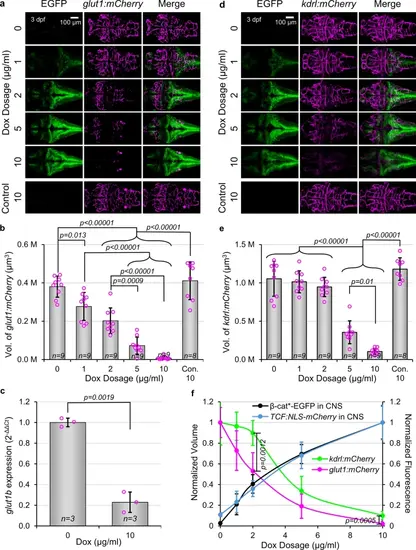
Activation of Wnt/β-catenin signaling in NPCs disrupts neurovascular development. (a) Representative dorsal images of gfap:rtTA, TRE:β-cat*-EGFP, glut1:mCherry larvae, or wild type siblings (Con.), treated with indicated Dox concentrations. (b) Quantification of mCherry fluorescence volume of larvae shown in (a). (c) Quantification of glut1b expression by qPCR. p-value was calculated using the parametric two-tailed t-test. Data are shown as mean ± standard deviation. (d) Representative dorsal images of gfap:rtTA, TRE:β-cat*-EGFP, kdrl:mCherry larvae, or wild type siblings (Con.), treated with indicated Dox concentrations. (e) Quantification of mCherry fluorescence volume of larvae shown in (d). p-values were calculated for comparisons of all groups using the parametric one-way analysis of variance (ANOVA) with Tukey HSD post hoc test (no label = not significant). Data are shown as mean ± standard deviation. (f) Normalization allowed for comparison of phenotypic dose dependency. Note the steeper slope of glut1:mCherry compared to kdrl:mCherry. p-values were calculated comparing glut1b:mCherry volume and kdrl:mCherry volume at each dosage using the non-parametric two-tailed Mann–Whitney Test. Data are shown as normalized mean ± standard deviation with smooth curve fit. |