FIGURE SUMMARY
Title

The conserved wobble uridine tRNA thiolase Ctu1 is required for angiogenesis and embryonic development

Authors
Yu, Y., Wang, C., Wang, Y., Shi, H., Hu, H., Du, Y., Zhou, Z.
Source
Full text @ PLoS One

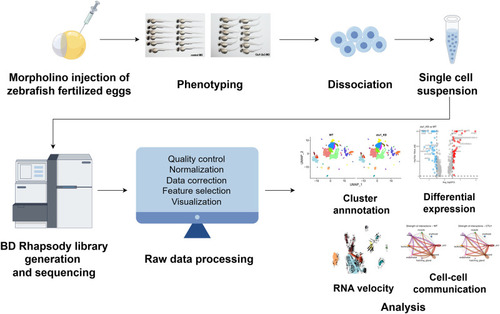
Schematic representation of workflow, figured (by Figdraw https://www.figdraw.com/).

Antisense MO oligonucleotides were microinjected into fertilized one-cell stage embryos. At 2-dpf, zebrafish larvae were either photographed for phentying, or collected for single-cell preparation and sequencing using BD Rhapsody system. After filtering the raw data, further single-cell data analysis was performed such as cluster annotation, DEGs analysis, RNA velocity, cell-cell communication.

ctu1 morphant zebrafish larvae exhibits developmental defects.

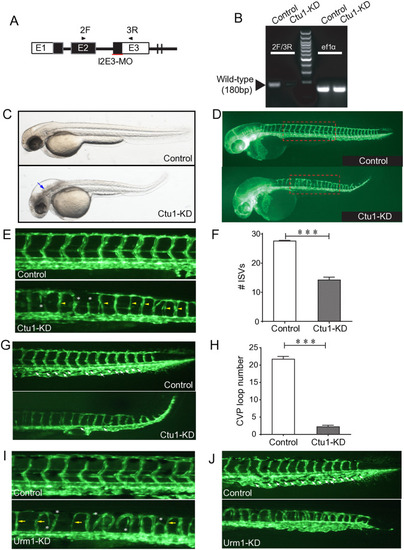
(A) Ctu1-targeted MO design strategy. (B) PCR analysis of control and Ctu1 morphant. (C and D) Bright-fieldand EGFP fluorescentimages depict the overall morphology of control and Ctu1 morphant at 2-dpf. Blue arrows indicate expanded brain ventricle and hindbrain edema in ctu1 morphant compared with control. The dotted square regions are shown at higher magnification in E. (E and G) Image of trunk regions. Compared with control MO, embryos injected with ctu1-i2e3-MO present a lower number of incomplete and thinner intersegmental vessels (ISVs, yellow arrows), and ectopic sprouts (asterisk) of dorsal aorta (E, lower panel). In control embryos, caudal vein plexus (CVP, white arrows) were formed honeycomb-like structures at the tail around 2-dpf (G, upper panel, arrowheads). In contrast, ctu1 deficency resulted in specific defects in CVP formation (G, lower panel, arrowheads). Quantification of the number of complete ISVs (F) and CVP (H). Columns, mean; bars, SEM (n = 10; unpaired student’s t-test; ***, p < 0.001). (I and J) Image of trunk regions. Compared with control MO, embryos injected with urm1-i2e2-MO present a lower number of incomplete and thinner ISVs (yellow arrows), and ectopic sprouts (asterisk) of dorsal aorta (I, lower panel). In control embryos, CVP (white arrows) were formed honeycomb-like structures at the tail around 2-dpf (J, upper panel, arrowheads). In contrast, urm1 deficency resulted in specific defects in CVP formation (J, lower panel, arrowheads).

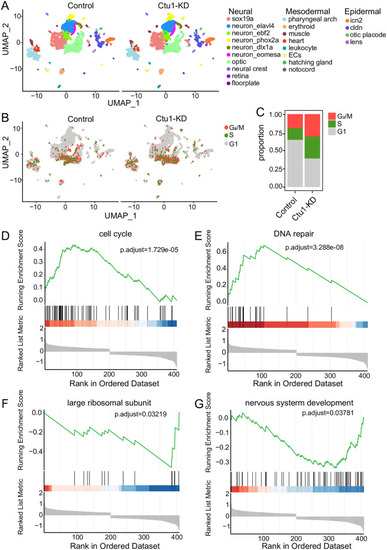
Single-cell transcriptome profiles of the ctu1 morphant and control zebrafish embryos.

UMAP visualization of all zebrafish cells, which are color-coded by cell type (A), and cell cycle phase (B). (C) The relative proportion of each cell cycle phase in the control and Ctu1 morphant. Gene sets of GSEA analysis shown are cell cycle (D), DNA repair (F), large ribosomal subunit (F) and nervous system development (G).

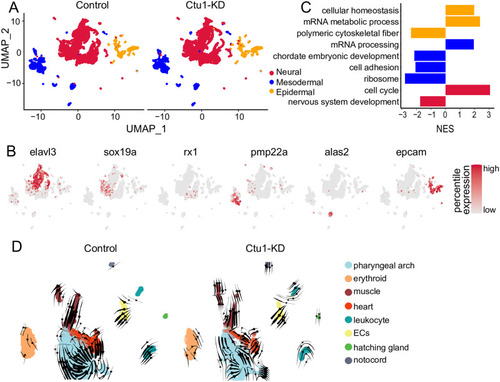
Comparative analysis of the control and ctu1 morphant across three main embryonic germ layers.

(A) UMAP visualization of three germ layers. (B) UMAP visualization of key marker genes expression. Color scale represents log-normalized expression. The marker genes for neural cells are elavl3, sox19a, rx1; for mesodermal cells, the markers are pmp22a and alas2; and for e pidermal cells, the marker gene is epcam. (C) The bar plot shows signal pathways affected by ctu1 deficiency in epidermal, mesodermal, and neural cells as identified by GSEA. All terms demonstrate significant enriched (adj.p < 0.05) and normalized enrichment scores (NES) are shown. (D) RNA velocity plot of control and ctu1 morphant mesodermal cells.

ctu1 deficiency suppresses erythrocyte differentiation.

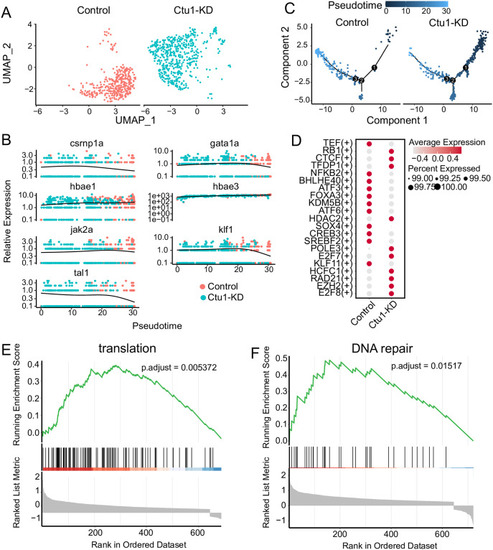
(A) UMAP visualization of erythroid cells, colored according to samples. (B) The relative expression of the marker genes associated with erythroid differentiation in the pseudotime trajectories of control and ctu1 morphant. (C) Pseudotime trajectories of erythroid cells. (D) Dot plots show changes in the expression of transcription factors across different samples. The color and size of circles indicate the average expression level and percentage of cells. GSEA analysis of control and ctu1 morphant. Gene sets shown are translation (E), and DNA repair (F).

ctu1 deficiency reduces the activity of the angpt and notch signaling pathways originated from the endothelial cells in mesoderm.

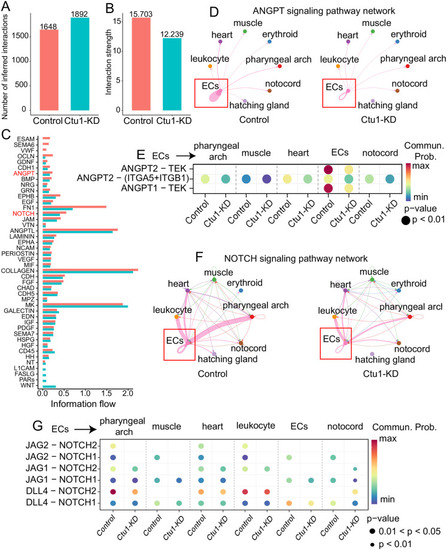
Bar plot shows overview number (A) and strength (B) in control and ctu1 morphant. (C) Ranking of active signaling pathways in control and ctu1 morphant based on their overall information flow within the inferred cellular networks. Signaling pathways are colored according to condition where they are enriched. (D) The chord plot shows angpt signaling in sending and receiving cells. Nodes are colored by celltypes. The thickness of the line represents the strength of the signal. (E) Dot plots show communication probability of angpt signaling between endothelial cells (senders) and each celltypes (receivers). Blue, low communication probability; red, high communication probability. Size of circle represents the pvalue of cells with communication probability. Chord plots (F) and Dot plots (G) shows notch signaling pathway network.

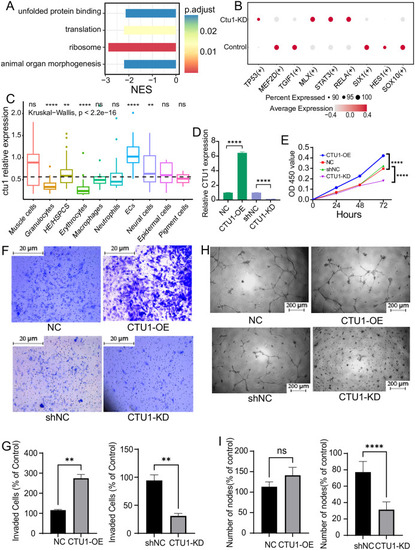
Single-cell data analysis of the endothelial cells in zebrafish, and the angiogenesis-related behaviors of human endothelial cells with differential expression of CTU1.

(A) The bar plot shows signal pathways affected by ctu1 deficiency in endothelial cells as identified by GSEA. (B) The dot plot illustrates the variation in transcription factor expression in control and ctu1 morphant, with the color and size of the circles representing the average expression level and the proportion of cells, respectively. (C) The box plot illustrates the relative expression levels of ctu1 of each cell type in 36-hpf zebrafish. ****, p < 0.0001. (D) The CTU1 expression levels of CTU1-KD and CTU1-OE HMEC-1 cells after exposing to the corresponding lentivirus. (E) The growth curve of CTU1-KD, CTU1-OE, and vehicle control HMEC-1 cells. Representative images (F) and quantifications of the migrated cells (G, n = 3 independent experiments) of HMEC-1 cells with different expression levels of CTU1 in the transwell assay. Scale bars represent 20 μm. Comparisons between each group were analyzed using Student’s t-test. **, p < 0.01. Representative images (H) and quantifications of the branch points (I, n = 3 independent experiments) of HMEC-1 cells with different expression levels of CTU1 in the tube formation assay. Scale bar, 200 μm. Comparisons between each group were analyzed using Student’s t-test. ****, p < 0.0001.

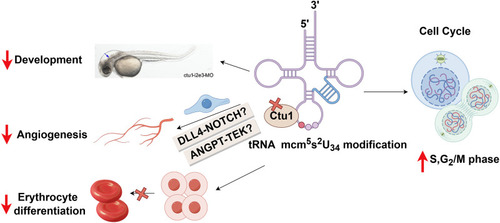
Model of the consequences of Ctu1 deficiency in zebrafish, figured by Figdraw.

Recently, the essential role of mcm5s2U34 tRNA modification and their modifying enzymes in proliferation and development has been demonstrated from yeast to mammals [7]. For example, double deletion of the partner enzymes (Ctu1 and Elp3) is lethal to the cell in yeast [14]. Inactivation of the CTU complex leads to a thermosensitive decrease with aberrant development in the nematode and fission yeast [15]. In mice, a deficiency in Elp1 causes male infertility [52], while Elp3-KO embryos exhibits significant growth retardation and fails to develop beyond E12.5 [13]. Here our finding provides the first experimental evidence that s2U34 tRNA modifying enzyme CTU1 is essential in cellular proliferation and development in vertebrates.

Acknowledgments
This image is the copyrighted work of the attributed author or publisher, and ZFIN has permission only to display this image to its users. Additional permissions should be obtained from the applicable author or publisher of the image. Full text @ PLoS One