
Image
|
Figure Caption
Fig 3
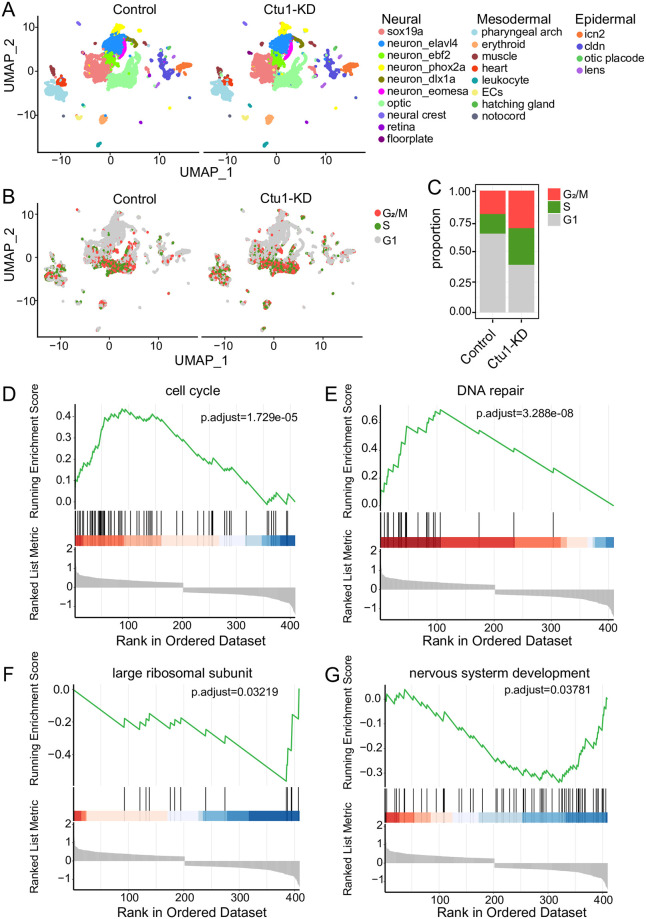
Single-cell transcriptome profiles of the
UMAP visualization of all zebrafish cells, which are color-coded by cell type (A), and cell cycle phase (B). (C) The relative proportion of each cell cycle phase in the control and Ctu1 morphant. Gene sets of GSEA analysis shown are cell cycle (D), DNA repair (F), large ribosomal subunit (F) and nervous system development (G).
Acknowledgments
This image is the copyrighted work of the attributed author or publisher, and
ZFIN has permission only to display this image to its users.
Additional permissions should be obtained from the applicable author or publisher of the image.
Full text @ PLoS One