IMAGE

Fig 7

ID
ZDB-IMAGE-250109-333
Source
Figures for Yu et al., 2024
Image
Figure Caption

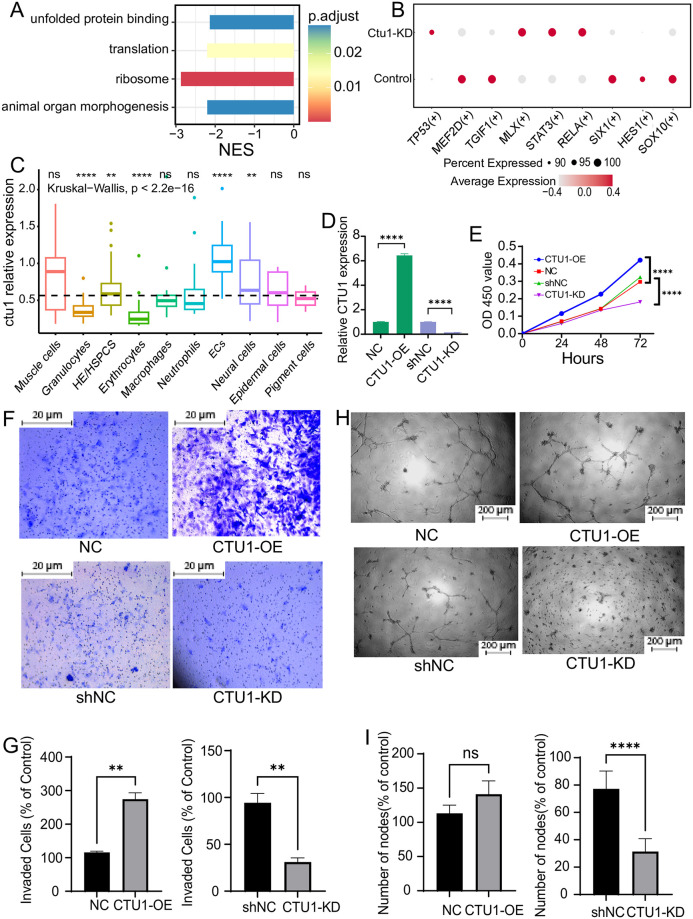
Fig 7 Single-cell data analysis of the endothelial cells in zebrafish, and the angiogenesis-related behaviors of human endothelial cells with differential expression of CTU1.

(A) The bar plot shows signal pathways affected by ctu1 deficiency in endothelial cells as identified by GSEA. (B) The dot plot illustrates the variation in transcription factor expression in control and ctu1 morphant, with the color and size of the circles representing the average expression level and the proportion of cells, respectively. (C) The box plot illustrates the relative expression levels of ctu1 of each cell type in 36-hpf zebrafish. ****, p < 0.0001. (D) The CTU1 expression levels of CTU1-KD and CTU1-OE HMEC-1 cells after exposing to the corresponding lentivirus. (E) The growth curve of CTU1-KD, CTU1-OE, and vehicle control HMEC-1 cells. Representative images (F) and quantifications of the migrated cells (G, n = 3 independent experiments) of HMEC-1 cells with different expression levels of CTU1 in the transwell assay. Scale bars represent 20 μm. Comparisons between each group were analyzed using Student’s t-test. **, p < 0.01. Representative images (H) and quantifications of the branch points (I, n = 3 independent experiments) of HMEC-1 cells with different expression levels of CTU1 in the tube formation assay. Scale bar, 200 μm. Comparisons between each group were analyzed using Student’s t-test. ****, p < 0.0001.

Acknowledgments
This image is the copyrighted work of the attributed author or publisher, and ZFIN has permission only to display this image to its users. Additional permissions should be obtained from the applicable author or publisher of the image. Full text @ PLoS One