
|
Fig 2
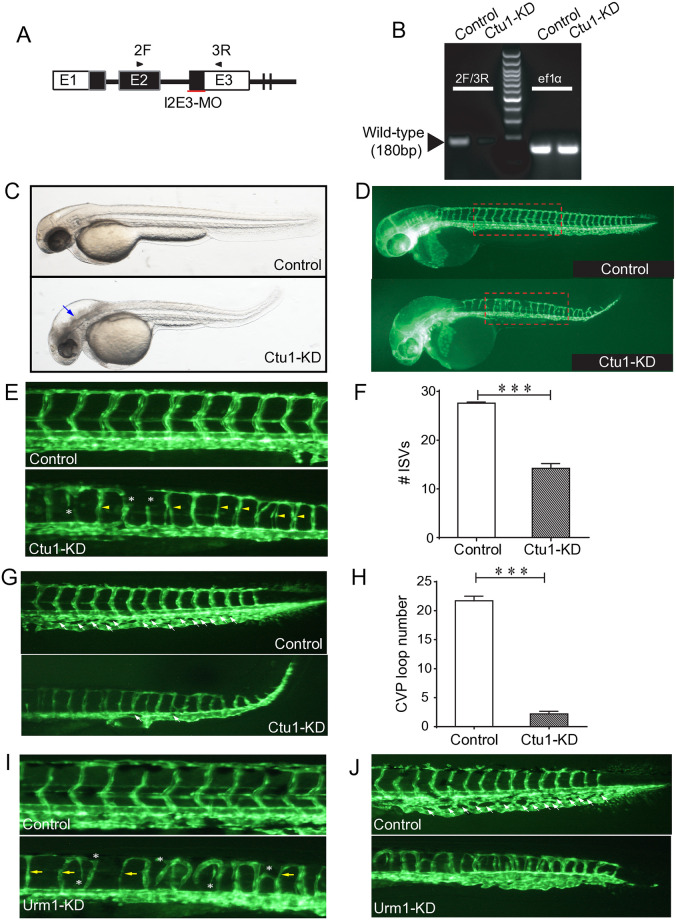
(A) Ctu1-targeted MO design strategy. (B) PCR analysis of control and Ctu1 morphant. (C and D) Bright-fieldand EGFP fluorescentimages depict the overall morphology of control and Ctu1 morphant at 2-dpf. Blue arrows indicate expanded brain ventricle and hindbrain edema in