IMAGE

Fig 6

ID
ZDB-IMAGE-250109-331
Source
Figures for Yu et al., 2024
Image
Figure Caption

Fig 6 ctu1 deficiency reduces the activity of the angpt and notch signaling pathways originated from the endothelial cells in mesoderm.

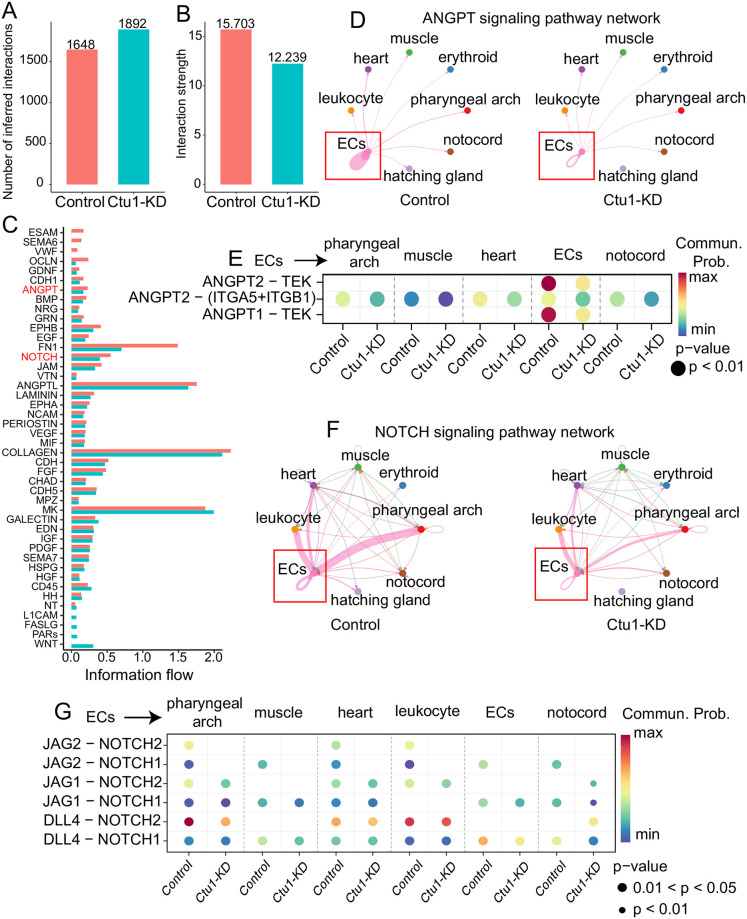
Bar plot shows overview number (A) and strength (B) in control and ctu1 morphant. (C) Ranking of active signaling pathways in control and ctu1 morphant based on their overall information flow within the inferred cellular networks. Signaling pathways are colored according to condition where they are enriched. (D) The chord plot shows angpt signaling in sending and receiving cells. Nodes are colored by celltypes. The thickness of the line represents the strength of the signal. (E) Dot plots show communication probability of angpt signaling between endothelial cells (senders) and each celltypes (receivers). Blue, low communication probability; red, high communication probability. Size of circle represents the pvalue of cells with communication probability. Chord plots (F) and Dot plots (G) shows notch signaling pathway network.

Acknowledgments
This image is the copyrighted work of the attributed author or publisher, and ZFIN has permission only to display this image to its users. Additional permissions should be obtained from the applicable author or publisher of the image. Full text @ PLoS One