
|
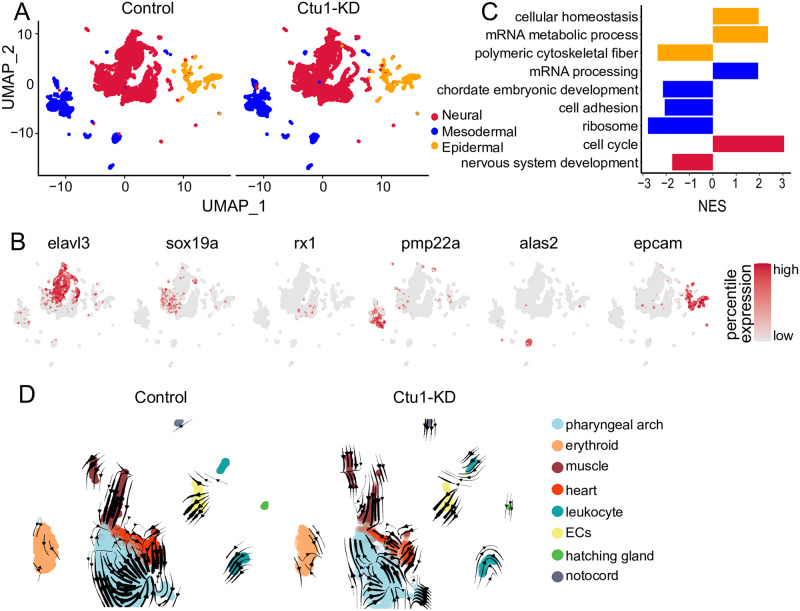
Fig 4
Comparative analysis of the control and
(A) UMAP visualization of three germ layers. (B) UMAP visualization of key marker genes expression. Color scale represents log-normalized expression. The marker genes for neural cells are