
- Title
-
Ketamine induces plasticity in a norepinephrine-astroglial circuit to promote behavioral perseverance
- Authors
- Duque, M., Chen, A.B., Hsu, E., Narayan, S., Rymbek, A., Begum, S., Saher, G., Cohen, A.E., Olson, D.E., Li, Y., Prober, D.A., Bergles, D.E., Fishman, M.C., Engert, F., Ahrens, M.B.
- Source
- Full text @ Neuron
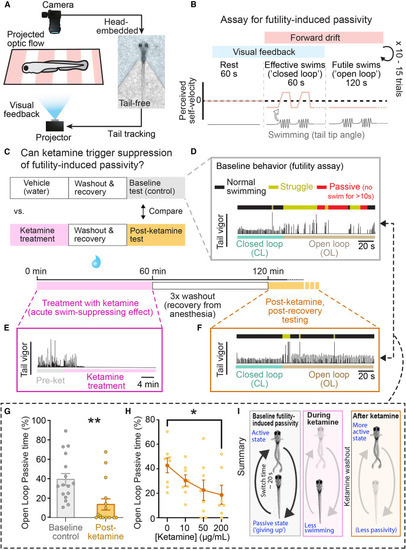
Brief ketamine exposure causes long-term suppression of futility-induced passivity in larval zebrafish (A) Schematic of experimental workflow for imaging swimming behavior in unparalyzed larval zebrafish. (B) Trial structure: 60 s of rest (no stimulus), 60 s of effective swimming (“closed loop,” forward optic flow, visual feedback), then 120 s of futile swimming (“open loop,” forward optic flow, no visual feedback), 10 to 15 repeated trials. (C) Timeline of experiments testing ketamine’s effect on futility-induced passivity. (D) Example trials for vehicle control fish showing tail vigor (rolling-window tail angle standard deviation) across time. Colors above swim trace indicate normal swimming (black), struggle (yellow), and passivity (red). Colors below swim trace indicate closed- (teal) and open-loop (brown) periods. (E) During ketamine treatment, fish tend to become quiescent. (F) After ketamine treatment and washout, example fish swims similarly to vehicle-treated fish in closed loop (cf. D, CL period), but in open loop, they are less passive and more active. (G) Ketamine-treated fish spend less time passive (periods > 10 s with no swimming) than vehicle controls during open loop. Mann-Whitney test, n = 16 fish (control), 15 fish (ketamine), p = 0.0010. (H) Dose-response curve of ketamine’s suppression of open-loop passive time. Mann-Whitney test, n = 8 fish (control), 8 fish (ketamine), p = 0.0289. All error bars denote standard error of the mean (SEM) ∗ p < 0.05 ∗∗ p < 0.01. (I) Summary of findings. |
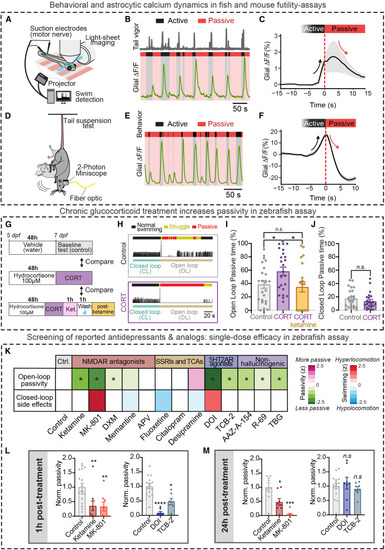
Translational potential and parallels between zebrafish and rodent futility-induced passivity assays (A) A light-sheet microscope recorded from radial astrocytes across the brain at cellular resolution while fictive behavior was monitored, and visual stimulus was delivered. (B) Swim traces (gray, tail vigor) showing active and passive periods and simultaneously recorded hindbrain astroglial calcium signals from an example fish. (C) Average open-loop struggle-triggered jRGECO1a signal in hindbrain glia (n = 3). (D) 2-photon imaging of cortical astrocyte calcium dynamics in the retrosplenial cortex using Aldh1l1-CreER and GCaMP6s mice using a head-mounted miniaturized microscope. (E) Active and passive periods and simultaneously recorded cortical astrocyte calcium signals in the retrosplenial cortex from an example mouse. (F) Average passivity-triggered cortical astrocytic signal. (n = 8). (G) Timeline of experiments testing the effect of chronic hydrocortisone (CORT) treatment on futility-induced passivity in larval zebrafish. (H) Example trials for control fish (K) and hydrocortisone-treated fish (L). Colors above swim trace indicate normal swimming (black), struggle (yellow), and passivity (red). Colors below swim trace indicate closed- (teal) and open-loop (brown) periods. Swim traces indicate tail vigor. (I) CORT-treated fish spend more time passive than vehicle controls during open loop. This effect was reversed by treatment with ketamine. One-way ANOVA with Welch’s correction for multiple comparisons, n = 23 (control), 23 (CORT), and 20 (ketamine-CORT). (CORT vs. control) p = 0.0274, (control vs. CORT-ketamine) p = 0.7266. (J) Average percentage of closed-loop (CL) spent in the passive state. Mann-Whitney test, n = 23 (control), 23 (CORT), p = 0.4453. (K) Open-loop passivity and closed-loop swim rate (“side-effects”) of fish treated with vehicle (control) or various pharmacological compounds (normalized to mean of control) in the futility-induced passivity assay. Results are grouped by major pharmacological target of treatment compound. ∗ Indicates p < 0.05 compared with control. (L) Acute (1 h post-washout) effects of (left) phencyclidine-site NMDA receptor antagonists and (right) 5-HT2A receptor agonists on open-loop passivity. (M) Persistent (24 h post-washout) effects of (left) phencyclidine-site NMDA receptor antagonists and (right) 5-HT2A receptor agonists. All error bars denote SEM. n.s. p > 0.05, ∗ p < 0.05, ∗∗ p < 0.01, ∗∗∗ p < 0.005, ∗∗∗∗ p < 0.001. Statistics for (L) and (M) one-way ANOVA with Tukey’s multiple comparison test (vs. control). (L, left), n = 17 (control), 10 (ketamine), 8 (MK-801), p = 0.0086 (ketamine), and 0.0115 (MK8-801). (L, right) 16 (control), 8 (DOI), 7 (TCB-2), p = <0.0001 (DOI), and 0.0008 (TCB-2). (M, left) n = 8 (control), 8 (ketamine), 8 (MK-801), p = 0.0103 (ketamine), <0.0001 (MK-801). (M, right) n = 16 (control), 8 (DOI), 8 (TCB-2), p = 0.8096 (DOI), and 0.8295 (TCB-2). |
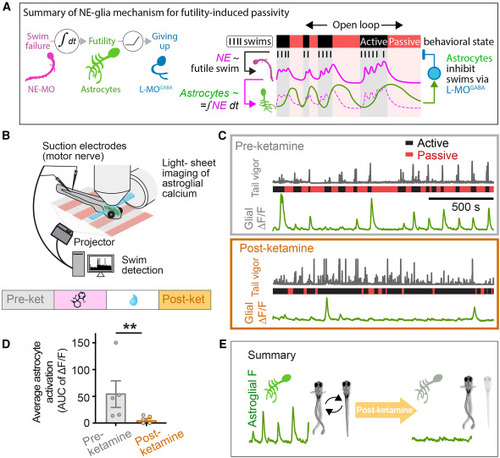
Brief ketamine exposure suppresses subsequent astrocyte calcium responses during futile swimming (A) Summary of mechanism underlying futility-induced passivity in zebrafish, adapted from Mu et al.9 (B) Whole-brain imaging of radial astrocyte calcium during behavior as described in the main text. (C) Swim traces (gray, tail vigor) showing active and passive periods and simultaneously recorded hindbrain astroglial calcium signals from two example Tg(gfap:jRGECO1a) fish either treated with vehicle control (pre-ketamine, top) or ketamine (post-ketamine, bottom). In both cases, fish were allowed to recover for 1 h following washout before recordings were performed. (D) Astrocytes are less active in the open-loop test period after ketamine treatment compared with control, as assessed by comparing the average ΔF/F (area under the curve) of astrocytic calcium after strong-swims before and after ketamine treatment. Mann-Whitney test. n = 5 (pre), 6 (post). p = 0.0087. (E) Summary of findings. Brief ketamine treatment causes, after washout, long-term reductions in passivity and hypo-activation of astrocytes compared with control. |
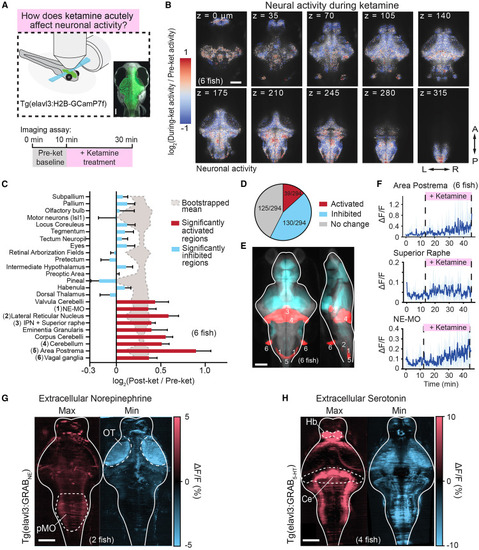
Activation of noradrenergic and serotoninergic populations following acute ketamine (A) Fish expressing the nuclear calcium indicator H2B-GCaMP7f under a pan-neuronal promoter were imaged using a light-sheet microscope before and during acute treatment with ketamine. Micrograph shows orientation of larval zebrafish brain as shown in the following panels. Scale bar, 100 μm. (B) Average activity changes across six registered fish (log-ratio of ΔF/F following ketamine administration to before administration) at different anatomical depths after ketamine treatment. (C) Selected Z-Brain76 areas activated significantly above (red) or below (blue) chance (background shaded region, 95% CI) following ketamine treatment. Chance levels determined through bootstrapping with shuffle indices (nBoot = 10,000). Numbers in parentheses correspond to regions in (E). (D) Proportion of Z-Brain76 areas activated significantly (same statistical assessment as in C) above, below, or at chance following ketamine treatment. A more comprehensive analysis for all areas is shown in Figure S4. (E) Brain areas that were significantly (same statistical assessment as in C) activated or inhibited following ketamine treatment in blue or red overlaid onto the reference atlas fish. Labeled numbers correspond to regions listed in (C). (F) Average neural activity (ΔF/F) of indicated noradrenergic and serotonergic regions across fish (n = 6 fish, top 10% cells for each region per fish). Shaded region denotes SEM. (G) Maximum and minimum values (along the Z-dimension, top-bottom of the brain) for average NE levels across the brain during ketamine exposure imaged using GRABNE2h (n = 2). OT, optic tectum, pMO, posterior medulla oblongata. (H) Maximum and minimum values (along the Z-dimension, top-bottom of the brain) for average 5-HT levels across the brain during ketamine exposure imaged using GRAB5-HT2.0 (n = 4). Ce, cerebellum, Hb, habenula. All scale bars, 100 μm. |
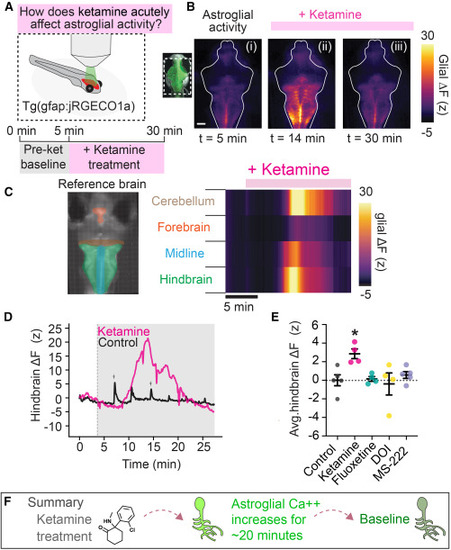
Ketamine triggers a long-lasting calcium elevation in astroglia (A) Fish expressing the calcium indicator jRGECO1a in astroglia were imaged using an epifluorescence microscope before and during acute treatment with ketamine for 30 min. (B) Example fluorescence micrographs of jRGECO1a signal at three time points illustrating elevation and return to baseline of cytosolic calcium in the presence of ketamine. Scale bar, 50 μm. (C) Heatmap of glial jRGECO1a signal in four ROIs (left) for fish in (C). Pink bar indicates ketamine in the bath. (D) Hindbrain jRGECO1a fluorescence change in an example fish treated with ketamine (200 μg/mL) or vehicle (control). Short increases in astrocytic calcium during struggles in control fish are indicated by gray arrowheads. (E) Average hindbrain fluorescence change following treatment with listed compounds. Ketamine, but not fluoxetine (SSRI), DOI (5-HT2AR agonist), or MS-222 (anesthetic), elevates cytosolic astroglial calcium. One-way ANOVA with Tukey’s multiple comparison test (vs. control). n = 5 (control, MS-222), 4 (all other conditions). p = 0.0169 (ketamine), 0.9395 (MS-222), 0.9893 (DOI), 0.9996 (fluoxetine). (F) Summary of findings. |
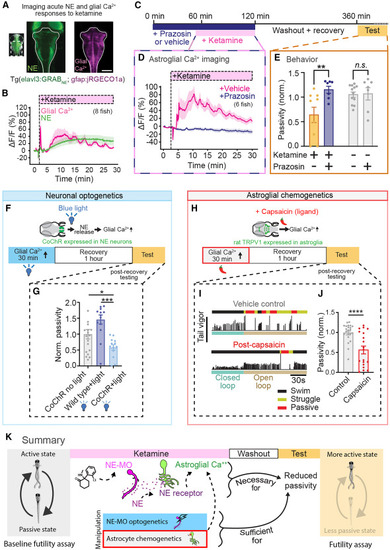
NE-dependent astroglial calcium elevation is required and sufficient for ketamine’s behavioral effects (A) Fluorescence image of a larval zebrafish expressing GRABNE2h under the elavl3 promoter (green) and jRGECO1a (glial Ca2+) under the gfap promoter (pink). Scale bar, 100 μm. (B) Simultaneously imaged intracellular glial Ca2+ dynamics (jRGECO1a signal) and extracellular NE dynamics (GRABNE2h signal). Traces represent mean of fish (n = 8), and shaded regions denote SEM. Shaded region indicates ketamine (200 μg/mL) in bath. (C) Schematic of experiments testing whether ketamine’s effects on astroglial Ca2+ and futility-induced passivity behavior depend on NE signaling. (D) Astroglial Ca2+ (jRGECO1a signal) response to ketamine (200 ug/mL) application in fish treated with 50 μM prazosin (n = 6) or vehicle control (n = 5). (E) Open-loop passivity for fish treated with ketamine, with or without α1 adrenergic blocker prazosin (100 μM). All error bars denote SEM. ∗ p < 0.05, ∗∗ p < 0.01, n.s. p > 0.4. ΔF (Z scored) for each fish was calculated as the difference between mean total fluorescence before treatment subtracted to total fluorescence at a specific time point, divided by the standard deviation of total fluorescence before treatment, for hindbrain mask (D). Two-way ANOVA with Sidak’s multiple comparison test. n = 7 (control-prazosin and ketamine-prazosin), 9 (ketamine-vehicle), 11 (control-vehicle). p = Interaction (0.0140), 0.0057 (ket-prazosin vs. ket-vehicle), 0.9947 (control-vehicle. vs. control-prazosin). (F) Tg(dbh:KalTA4; UAS:CoChR-eGFP) fish expressing the channelrhodopsin CoChR in norepinephrinergic (NE) neurons were continually stimulated optogenetically with blue (488 nm) light for 30 min. Fish were allowed to recover for an hour then assayed for futile swimming. (G) Passivity normalized to clutch, non-stimulated controls. Optogenetic stimulation suppressed futility-induced passivity following recovery compared with non-stimulated clutch controls and non-expression controls stimulated with blue light. One-way ANOVA with Sidak’s multiple comparison test. n = 19 (dbh:CoChr, no light), 14 (wild type, blue light), 13 (dbh:CoChr, blue). p = 0.0004 (WT-Blue light vs. DBH-Blue light), p = 0.0392 (WT-Blue light vs. DBH-no light), p = 0.0392 (DBH-no light vs. DBH-Blue light). (H) Transgenic fish expressing rat TRPV1 in astroglia were treated with capsaicin for 30 min. After 30 min, capsaicin was washed out and fish allowed to recover for 1 h before being tested. (I) Example swimming of capsaicin-treated fish (bottom) and untreated clutch controls (top). Black, yellow, and red segments above swim vigor trace denote regular swimming, struggling, and passivity, respectively. (J) Passivity normalized to untreated clutch controls. Capsaicin-treated fish exhibit decreased futility-induced passivity, although the distribution of passivity duration is bimodal. Mann-Whitney test. n = 22 (control), 19 (capsaicin), p = 0.0005. (K) Summary of findings. |
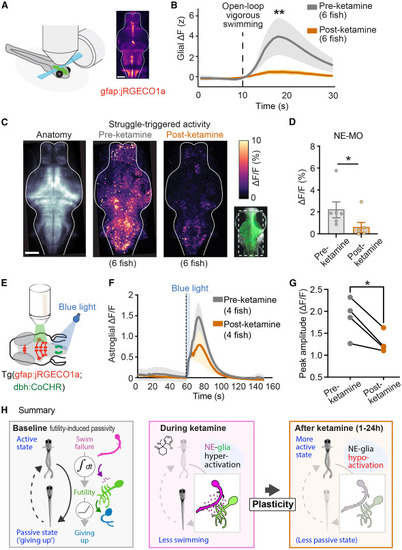
Persistent suppression of futility-activated neuron-astroglial circuits following ketamine exposure (A) A light-sheet microscope recorded from most radial astrocytes and neurons in the brain at cellular resolution (STAR Methods). (B) Astrocyte jRGECO1a signal following standardized strong swims in fish before and treatment with ketamine Same dataset as Figure 3D. Mann-Whitney test. n = 5 (pre), 6 (post). p = 0.0087. (C) Left: anatomical max projection of Tg(elavl3:H2B-GCaMP7f) fish imaged during behavior. (middle) max projection of futile-swim-triggered neural activity of untreated fish (n = 6). Right: max projection of futile-swim-triggered neural activity of ketamine-treated fish shown pre-ketamine and post-ketamine (n = 6). (D) Average struggle-triggered ΔF/F in NE-MO cells before and after ketamine treatment. Mann-Whitney test. n = 6 (pre), 6 (post). p = 0.041. (E) Transgenic fish expressing the channelrhodopsin CoChR in norepinephrinergic (NE) neurons and the calcium sensor jRGECO1a in glia were briefly stimulated optogenetically with blue (488 nm) light for 5 s while recording glial activity. (F) Average ΔF/F traces showing glial calcium responses after NE-MO stimulation with blue light, before (pre-ket) and after (post-ket) ketamine treatment, with different fish for pre/post. (G) Peak amplitude (ΔF/F) following blue light stimulation in the same pre-ket and post-ket fish. Two-tailed paired t test. n = 4 pairs. p = 0.0268. All error bars denote SEM. ∗ p < 0.05, ∗∗ p < 0.01. (H) Summary of findings. |
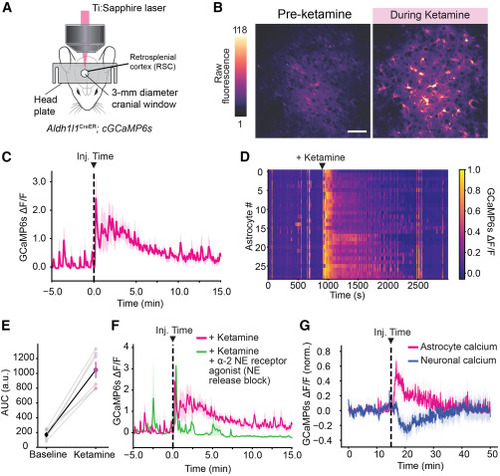
Ketamine elevates astrocytic calcium in mammalian astrocytes in vivo through conserved signaling pathways (A) Schematic showing setup for in vivo imaging of cortical astrocytic calcium in awake mice. (B) Fluorescence micrographs of GCaMP6s signal in the retrosplenial cortex (RSC), for an example mouse at two time points illustrating elevation of cytosolic calcium following IP injection of 20 mg/kg ketamine. Scale bar, 50 μm. (C) Average RSC ΔF/F trace in response to 20 mg/kg ketamine (n = 6), injected at 15 min (dotted line). (D) ΔF/F for individual astrocytes over time in response to 20 mg/kg ketamine (black arrow). (E) Quantification of RSC fluorescence change before and after ketamine injection, normalized to control. Paired two-tailed test. n = 6. p = 0.0003. (F) Average RSC ΔF/F trace for mice injected with 20 mg/kg ketamine or 20 mg/kg ketamine plus 0.05 mg/kg of an alpha-2 agonist, dexmedetomidine. n = 5. ∗∗ p < 0.01. (G) Average RSC ΔF/F trace for astrocytes (pink) and excitatory neurons (blue) in response to 20 mg/kg ketamine, injected at 15 min (dotted line) using Aldh1l1-CreER;GCaMP6s;Thy1-jRGECO mice. n = 4. |