
|
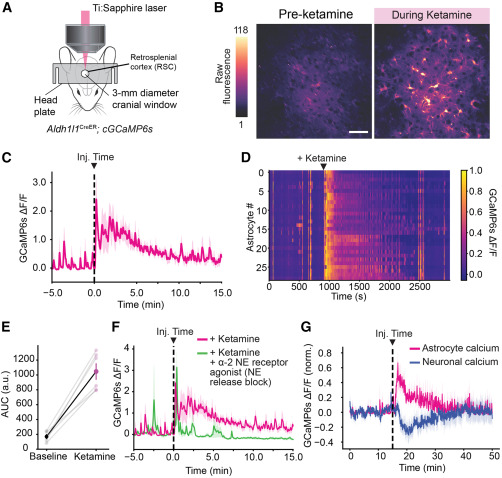
Fig. 8 Ketamine elevates astrocytic calcium in mammalian astrocytes in vivo through conserved signaling pathways (A) Schematic showing setup for in vivo imaging of cortical astrocytic calcium in awake mice. (B) Fluorescence micrographs of GCaMP6s signal in the retrosplenial cortex (RSC), for an example mouse at two time points illustrating elevation of cytosolic calcium following IP injection of 20 mg/kg ketamine. Scale bar, 50 μm. (C) Average RSC ΔF/F trace in response to 20 mg/kg ketamine (n = 6), injected at 15 min (dotted line). (D) ΔF/F for individual astrocytes over time in response to 20 mg/kg ketamine (black arrow). (E) Quantification of RSC fluorescence change before and after ketamine injection, normalized to control. Paired two-tailed test. n = 6. p = 0.0003. (F) Average RSC ΔF/F trace for mice injected with 20 mg/kg ketamine or 20 mg/kg ketamine plus 0.05 mg/kg of an alpha-2 agonist, dexmedetomidine. n = 5. ∗∗ p < 0.01. (G) Average RSC ΔF/F trace for astrocytes (pink) and excitatory neurons (blue) in response to 20 mg/kg ketamine, injected at 15 min (dotted line) using Aldh1l1-CreER;GCaMP6s;Thy1-jRGECO mice. n = 4.