
|
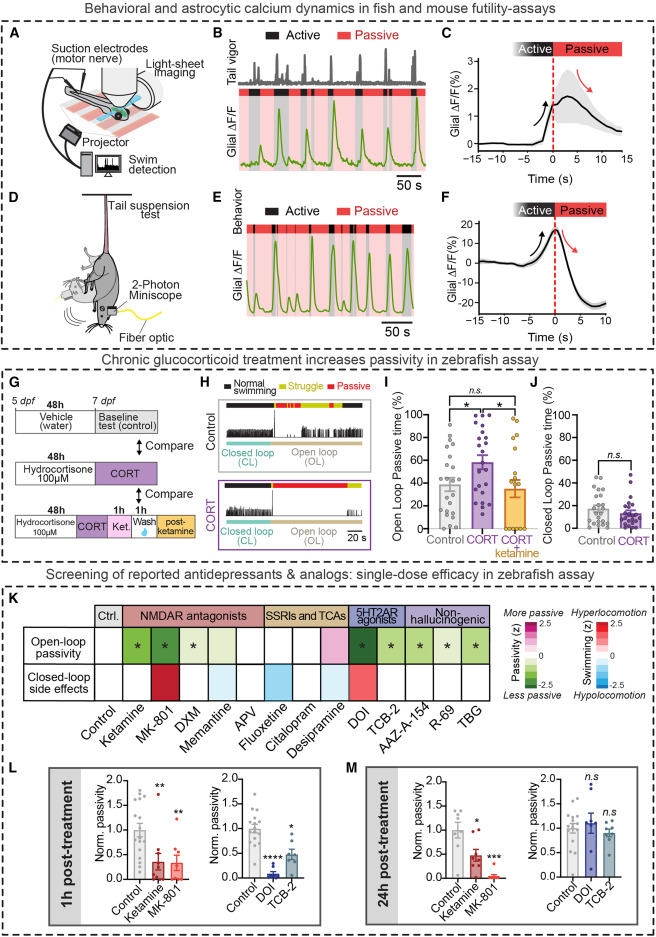
Fig. 2 Translational potential and parallels between zebrafish and rodent futility-induced passivity assays (A) A light-sheet microscope recorded from radial astrocytes across the brain at cellular resolution while fictive behavior was monitored, and visual stimulus was delivered. (B) Swim traces (gray, tail vigor) showing active and passive periods and simultaneously recorded hindbrain astroglial calcium signals from an example fish. (C) Average open-loop struggle-triggered jRGECO1a signal in hindbrain glia (n = 3). (D) 2-photon imaging of cortical astrocyte calcium dynamics in the retrosplenial cortex using Aldh1l1-CreER and GCaMP6s mice using a head-mounted miniaturized microscope. (E) Active and passive periods and simultaneously recorded cortical astrocyte calcium signals in the retrosplenial cortex from an example mouse. (F) Average passivity-triggered cortical astrocytic signal. (n = 8). (G) Timeline of experiments testing the effect of chronic hydrocortisone (CORT) treatment on futility-induced passivity in larval zebrafish. (H) Example trials for control fish (K) and hydrocortisone-treated fish (L). Colors above swim trace indicate normal swimming (black), struggle (yellow), and passivity (red). Colors below swim trace indicate closed- (teal) and open-loop (brown) periods. Swim traces indicate tail vigor. (I) CORT-treated fish spend more time passive than vehicle controls during open loop. This effect was reversed by treatment with ketamine. One-way ANOVA with Welch’s correction for multiple comparisons, n = 23 (control), 23 (CORT), and 20 (ketamine-CORT). (CORT vs. control) p = 0.0274, (control vs. CORT-ketamine) p = 0.7266. (J) Average percentage of closed-loop (CL) spent in the passive state. Mann-Whitney test, n = 23 (control), 23 (CORT), p = 0.4453. (K) Open-loop passivity and closed-loop swim rate (“side-effects”) of fish treated with vehicle (control) or various pharmacological compounds (normalized to mean of control) in the futility-induced passivity assay. Results are grouped by major pharmacological target of treatment compound. ∗ Indicates p < 0.05 compared with control. (L) Acute (1 h post-washout) effects of (left) phencyclidine-site NMDA receptor antagonists and (right) 5-HT2A receptor agonists on open-loop passivity. (M) Persistent (24 h post-washout) effects of (left) phencyclidine-site NMDA receptor antagonists and (right) 5-HT2A receptor agonists. All error bars denote SEM. n.s. p > 0.05, ∗ p < 0.05, ∗∗ p < 0.01, ∗∗∗ p < 0.005, ∗∗∗∗ p < 0.001. Statistics for (L) and (M) one-way ANOVA with Tukey’s multiple comparison test (vs. control). (L, left), n = 17 (control), 10 (ketamine), 8 (MK-801), p = 0.0086 (ketamine), and 0.0115 (MK8-801). (L, right) 16 (control), 8 (DOI), 7 (TCB-2), p = <0.0001 (DOI), and 0.0008 (TCB-2). (M, left) n = 8 (control), 8 (ketamine), 8 (MK-801), p = 0.0103 (ketamine), <0.0001 (MK-801). (M, right) n = 16 (control), 8 (DOI), 8 (TCB-2), p = 0.8096 (DOI), and 0.8295 (TCB-2).