
Fig. 4
- ID
- ZDB-FIG-250311-148
- Publication
- Duque et al., 2024 - Ketamine induces plasticity in a norepinephrine-astroglial circuit to promote behavioral perseverance
- Other Figures
- All Figure Page
- Back to All Figure Page
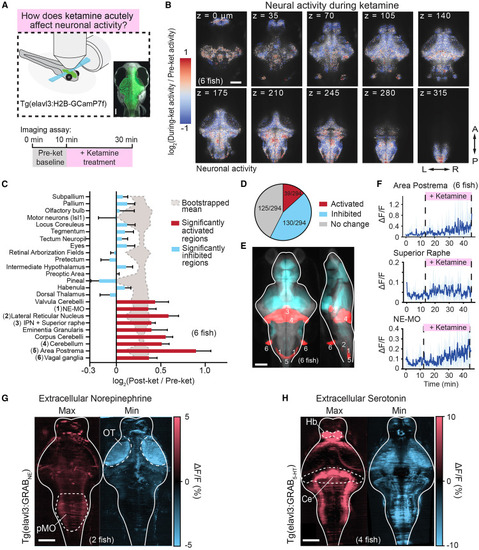
Activation of noradrenergic and serotoninergic populations following acute ketamine (A) Fish expressing the nuclear calcium indicator H2B-GCaMP7f under a pan-neuronal promoter were imaged using a light-sheet microscope before and during acute treatment with ketamine. Micrograph shows orientation of larval zebrafish brain as shown in the following panels. Scale bar, 100 μm. (B) Average activity changes across six registered fish (log-ratio of ΔF/F following ketamine administration to before administration) at different anatomical depths after ketamine treatment. (C) Selected Z-Brain76 areas activated significantly above (red) or below (blue) chance (background shaded region, 95% CI) following ketamine treatment. Chance levels determined through bootstrapping with shuffle indices (nBoot = 10,000). Numbers in parentheses correspond to regions in (E). (D) Proportion of Z-Brain76 areas activated significantly (same statistical assessment as in C) above, below, or at chance following ketamine treatment. A more comprehensive analysis for all areas is shown in Figure S4. (E) Brain areas that were significantly (same statistical assessment as in C) activated or inhibited following ketamine treatment in blue or red overlaid onto the reference atlas fish. Labeled numbers correspond to regions listed in (C). (F) Average neural activity (ΔF/F) of indicated noradrenergic and serotonergic regions across fish (n = 6 fish, top 10% cells for each region per fish). Shaded region denotes SEM. (G) Maximum and minimum values (along the Z-dimension, top-bottom of the brain) for average NE levels across the brain during ketamine exposure imaged using GRABNE2h (n = 2). OT, optic tectum, pMO, posterior medulla oblongata. (H) Maximum and minimum values (along the Z-dimension, top-bottom of the brain) for average 5-HT levels across the brain during ketamine exposure imaged using GRAB5-HT2.0 (n = 4). Ce, cerebellum, Hb, habenula. All scale bars, 100 μm. |