
|
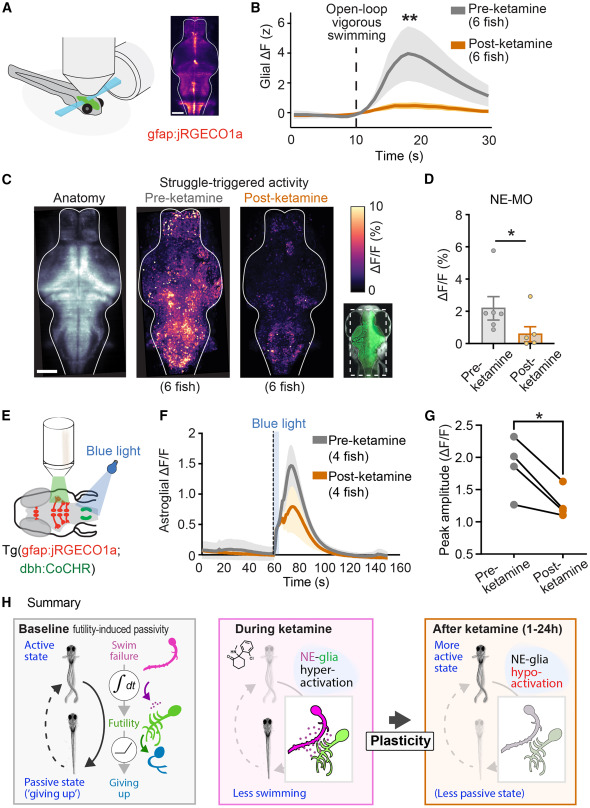
Fig. 7 Persistent suppression of futility-activated neuron-astroglial circuits following ketamine exposure (A) A light-sheet microscope recorded from most radial astrocytes and neurons in the brain at cellular resolution (STAR Methods). (B) Astrocyte jRGECO1a signal following standardized strong swims in fish before and treatment with ketamine Same dataset as Figure 3D. Mann-Whitney test. n = 5 (pre), 6 (post). p = 0.0087. (C) Left: anatomical max projection of Tg(elavl3:H2B-GCaMP7f) fish imaged during behavior. (middle) max projection of futile-swim-triggered neural activity of untreated fish (n = 6). Right: max projection of futile-swim-triggered neural activity of ketamine-treated fish shown pre-ketamine and post-ketamine (n = 6). (D) Average struggle-triggered ΔF/F in NE-MO cells before and after ketamine treatment. Mann-Whitney test. n = 6 (pre), 6 (post). p = 0.041. (E) Transgenic fish expressing the channelrhodopsin CoChR in norepinephrinergic (NE) neurons and the calcium sensor jRGECO1a in glia were briefly stimulated optogenetically with blue (488 nm) light for 5 s while recording glial activity. (F) Average ΔF/F traces showing glial calcium responses after NE-MO stimulation with blue light, before (pre-ket) and after (post-ket) ketamine treatment, with different fish for pre/post. (G) Peak amplitude (ΔF/F) following blue light stimulation in the same pre-ket and post-ket fish. Two-tailed paired t test. n = 4 pairs. p = 0.0268. All error bars denote SEM. ∗ p < 0.05, ∗∗ p < 0.01. (H) Summary of findings.