
- Title
-
Reprogramming miR-146b-snphb Signaling Activates Axonal Mitochondrial Transport in the Zebrafish M-cell and Facilitates Axon Regeneration After Injury
- Authors
- Wang, X.L., Wang, Z.Y., Chen, X.H., Cai, Y., Hu, B.
- Source
- Full text @ Neurosci. Bull.
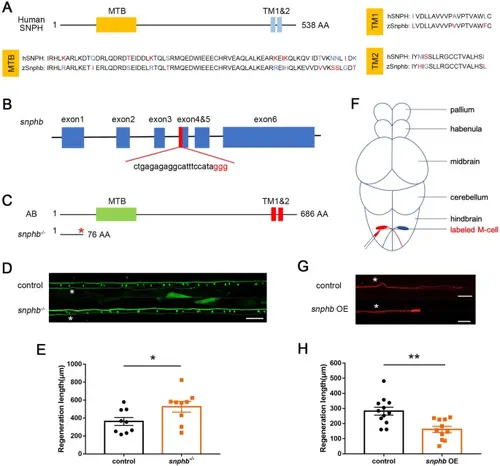
snphb negatively regulates M-cell axon regeneration. A Zebrafish SNPHB is highly conserved with human SNPH in the MTB and TMs domains (alignment by http://multalin.toulouse.inra.fr/multalin/). B SgRNA target site located in the fourth exon of snphb. C Schematic of the protein sequence showed that snphb-/- zebrafish expressed SNPHB with deletion of MTB and TMs domains. D, E Representative images of control (T056) and snphb-/- M-cell axon regeneration results. Statistical results showed snphb knockout enhanced axon regeneration in zebrafish M-cells. White asterisk denotes the injury site. Scale bar, 50 μm, * P < 0.05, error bars indicate SEM. F Schematic of in vivo single-cell electroporation. G, H Representative images of overexpression backbone (control) and snphb OE axon regeneration results. Statistical results showed that snphb OE impeded axon regeneration in zebrafish M-cells. OE bg: 282.3 ± 26.12 μm; snphb OE: 161.5 ± 20.31 μm. White asterisk denotes the injury site. Scale bar, 50 μm, ** P < 0.01, error bars indicate SEM. |
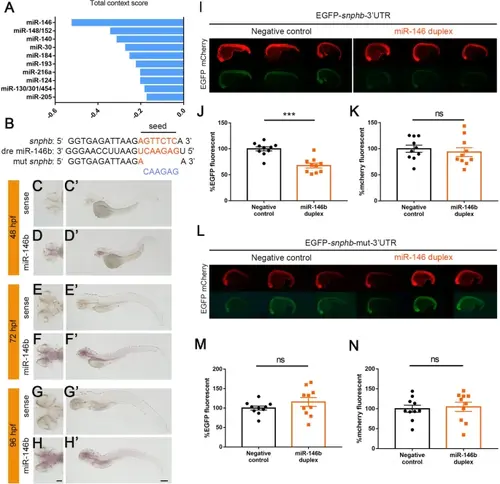
miR-146b targets snphb in vivo. A Total context score of potential upstream miRNAs for snphb (only the top 10 miRNAs were displayed). The smaller the score, the more likely it is to be involved in the regulation of snphb. B Sequence alignment of zebrafish miR-146b, snphb 3'-UTR, and its mutation. Seed sequences were highlighted in orange and mutation sequences were shown in blue. C–H Expression patterns of miR-146b in zebrafish larvae (scale bar, 100 μm). C’–H’ Localization of miR-146b in larval brains (scale bar, 200 μm). The dorsal and lateral views at different stages revealed that miR-146b is expressed throughout the CNS, similar to the snphb expression pattern. I–K EGFP-snphb 3'-UTR fluorescent signals attenuated when miR-146b duplex was co-injected compared to nonsense duplex (as negative control). There was no significant change in fluorescence signals of the mCherry mRNA (as control). EGFP and mCherry fluorescence were shown as a percentage of the fluorescent signals recorded from the negative control. EGFP signals: negative control: 100.00% ± 3.981%; miR-146b duplex: 67.71% ± 4.507%, *** P < 0.001; mCherry signals: negative control: 100.00% ± 6.809%; miR-146b duplex: 93.67% ± 8.502%. L–N There was no significant change in both EGFP-snphb 3'-UTR and mCherry fluorescent signals after seed sequences mutation, regardless of the injection of nonsense or miR-146b duplex. EGFP and mCherry fluorescence were shown as a percentage of the fluorescent signals recorded from the negative control. EGFP signals: negative control: 100.00% ± 5.237%; miR-146b duplex: 115.7% ± 11.370%; mCherry signals: negative control: 100.00% ± 8.97%; miR-146b duplex: 104.7% ± 11.62%. Error bars indicate SEM. |
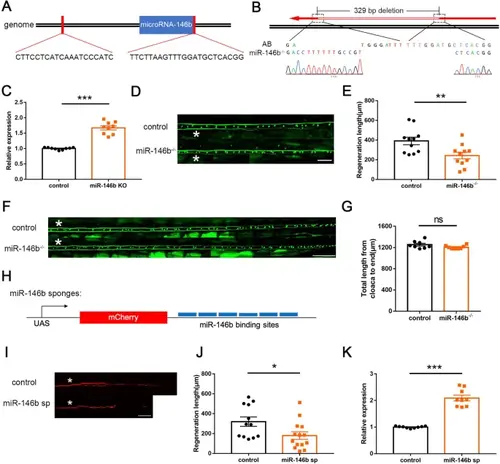
miR-146b loss-of-function inhibits M-cell axon regeneration by upregulating snphb. A Schematic of sgRNA target sites on both sides of microRNA-146b. B Sequencing results showed a ~329 bp deletion containing microRNA-146b in the miR-146b-/- mutants. C Quantitative RT-PCR assays showed a significant increase in snphb expression in the brains of 5-month-old adult miR-146b-/- mutants. D, E Representative images of control (T056) and miR-146b-/- M-cell axon regeneration results. Statistical results showed that miR-146b deletion inhibits axon regeneration in zebrafish M-cells. White asterisk denotes the injury site. Control: 390.9 ± 38.05 μm; miR-146b-/-: 242.1 ± 33.37 μm. Scale bar, 50 μm, ** P < 0.01, error bars indicate SEM. F, G No significant difference in the length of axons from the cloaca to the end between control (T056) and miR-146b-/- M-cell. A white asterisk denotes the defined sites. Control: 1253 ± 25.02 μm; miR-146b-/-: 1204 ± 11.70 μm. Scale bar, 100 μm, error bars indicate SEM. H Schematic diagram of miR-146b sponges (miR-146b sp). I, J Representative images of control (UAS-mCherry) and miR-146b sp axon regeneration results. Statistical results showed that miR-146b sp impeded axon regeneration in zebrafish M-cells. Control: 319.9 ± 46.98 μm; miR-146b sp: 180.0 ± 37.50 μm. White asterisk denotes the injury site. Scale bar, 50 μm, * P < 0.05, error bars indicate SEM. K Quantitative RT-PCR showed that the expression of snphb was significantly increased at 10 hpf in embryos expressing miR-146b sp. |
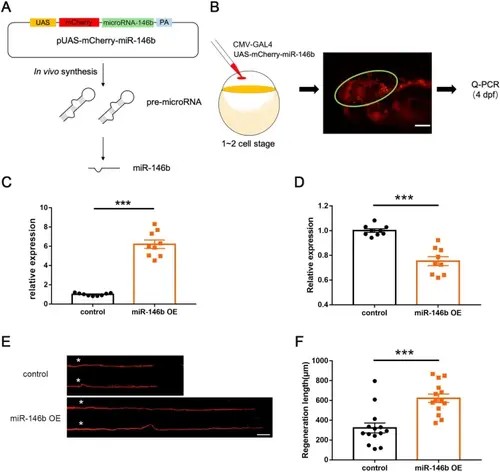
Reprogramming miR-146b-snphb signaling promotes M-cell axon regeneration. A Schematic of the in vivo overexpression system of miR-146b. B Validation of vector-based miR-146b overexpression. The circle indicates neurons in the brain that express fluorescent signals. C MiR-146b levels were significantly increased by vector-based expression in vivo. D Quantitative RT-PCR showed that the expression of snphb was significantly reduced at 10 hpf in embryos overexpressing miR-146b. E, F Representative images of control (UAS-mCherry) and miR-146b OE axon regeneration results. Statistical results showed that miR-146b OE enhanced axon regeneration in zebrafish M-cells. Control: 322.1 ± 49.65 μm; miR-146b OE: 622.2 ± 42.48 μm. White asterisk denotes the injury site. Scale bar, 50 μm, *** P < 0.001, error bars indicate SEM. |
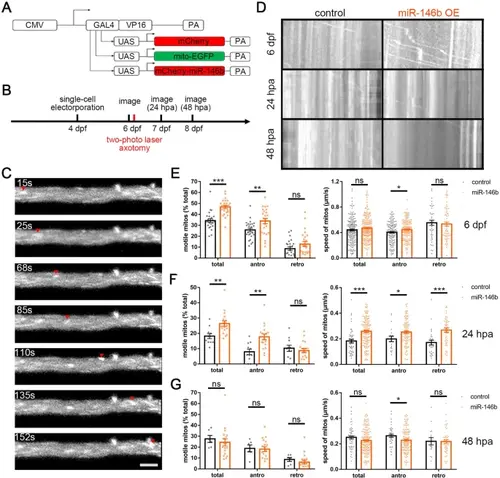
Reprogramming miR-146b-snphb signaling activates M-cell axonal mitochondrial transport. A Schematic diagram of miR-146b overexpression system and mitochondrial tracer vector. UAS-mito-EGFP: plasmid that labels mitochondria with EGFP signaling. B Time-point diagram of mitochondrial dynamic imaging and axotomy. C Representative images of moving mitochondria tracked by in vivo time-lapse confocal imaging in the M-cell axon (arrowheads trace a motile mitochondrion). Scale bar, 5 μm. D Kymographs depict mitochondrial movement at 6 dpf, 24 hpa, and 48 hpa in the control and miR-146b OE group. E Reprogramming miR-146b signaling resulted in an increase in the proportion of motile mitochondria in the M-cell and the velocity of mitochondria moving in the anterograde direction at 6 dpf. Total: control: 34.35% ± 1.70% vs. miR-146b: 46.73% ± 1.51%, *** P < 0.001; antro: control: 25.72% ± 1.75% vs. miR-146b: 33.90% ± 2.45%, ** P < 0.01; retro: control: 8.63% ± 1.59% vs. miR-146b: 12.83% ± 2.31%. Velocity: total: control: 0.44 ± 0.015 μm/s, n = 194 mitos vs. miR-146b: 0.47 ± 0.012 μm/s, n = 232 mitos; antro: control: 0.404 ± 0.013 μm/s, n = 147 mitos vs. miR-146b: 0.445 ± 0.012 μm/s, n = 169 mitos, * P < 0.05; retro: control: 0.553 ± 0.04 μm/s, n = 47 mitos vs. miR-146b: 0.534 ± 0.032 μm/s, n = 63 mitos (24 videos of 8 fishes per group). F Overexpression of miR-146b promoted the proportion of mobile mitochondria and the velocity of mitochondria in the M-cell axon at 24 hpa. Total: control: 18.22% ± 1.63% vs. miR-146b: 26.43% ± 1.76%, ** P < 0.01; antro: control: 7.96% ± 1.78% vs. miR-146b: 17.69% ± 1.86%, ** P < 0.01; retro: control: 10.26% ± 2.00% vs. miR-146b: 8.73% ± 1.41%. Velocity: total: control: 0.182 ± 0.014 μm/s, n = 48 mitos vs. miR-146b: 0.258 ± 0.009 μm/s, n = 151 mitos, *** P < 0.001; antro: control: 0.199 ± 0.021 μm/s, n = 20 mitos vs. miR-146b: 0.253 ± 0.010 μm/s, n = 98 mitos, * P < 0.05; retro: control: 0.170 ± 0.019 μm/s, n = 28 mitos vs. miR-146b: 0.268 ± 0.018 μm/s, n = 53 mitos, *** P < 0.001 (control: 11 videos from 4 fishes; miR-146b: 18 videos from 6 fishes). G Overexpression of miR-146b barely affected mitochondrial trafficking of the M-cell axon at 48 hpa. Total: control: 27.54% ± 3.21% vs. miR-146b: 24.41% ± 3.28%; antro: control: 18.84% ± 3.14% vs. miR-146b: 18.18% ± 2.26%; retro: control: 8.69% ± 1.79% vs. miR-146b: 6.23% ± 1.74%. Velocity: total: control: 0.250 ± 0.013 μm/s, n = 52 mitos vs. miR-146b: 0.225 ± 0.007 μm/s, n = 162 mitos; antro: control: 0.263 ± 0.013 μm/s, n = 37 mitos vs. miR-146b: 0.223 ± 0.009 μm/s, n = 119 mitos, * P < 0.05; retro: control: 0.220 ± 0.029 μm/s, n = 15 mitos vs. miR-146b: 0.218 ± 0.015 μm/s, n = 44 mitos (control: 6 videos from 2 fishes; miR-146b: 18 videos from 6 fishes). |
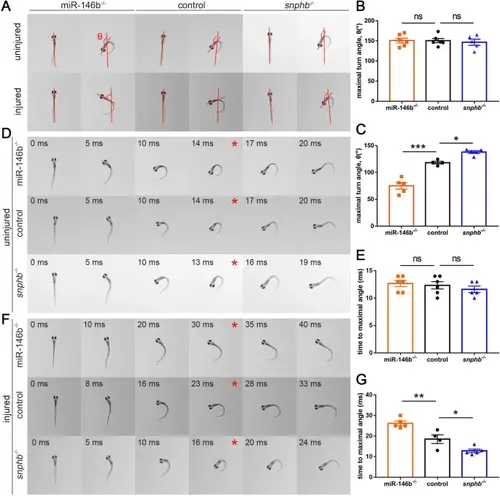
Escape response tests showed the positive effect of the miR-146b-snphb axis on M-cell function recovery. A Representative images of initial orientation and maximal turn angle of zebrafish larvae in the uninjured and injured groups. Red lines indicate the orientation before and after the escape behavior. B, C Statistical analysis of the maximal turn angle. Uninjured: control: 150.7 ± 5.3°; miR-146b-/-: 151.0 ± 6.0°; snphb-/-: 146.8 ± 7.6°; ns, not significant. Injured: control: 118.4 ± 2.6°; miR-146b-/-: 75.08 ± 6.1°, *** P < 0.001; snphb-/-: 138.1 ± 2.5°, * P < 0.05. Assessed by ordinary one-way ANOVA/Tukey’s multiple-comparisons test. Error bars indicate SEM. D A series of images from the escape behavior of zebrafish larvae in the uninjured and injured groups. Red asterisks indicate the maximal turn angle. E, F Statistical analysis of the time to maximal turn angle. Uninjured: control: 12.33 ± 0.7 ms; miR-146b-/-: 12.67 ± 0.6 ms; snphb-/-: 11.6 ± 0.6 ms; ns, not significant. Injured: control: 18.5 ± 2.1 ms; miR-146b-/-: 26.2 ± 1.1 ms, ** P < 0.01; snphb-/-: 12.8 ± 0.9 ms, * P < 0.05. Assessed by ordinary one-way ANOVA. Error bars indicate SEM. |
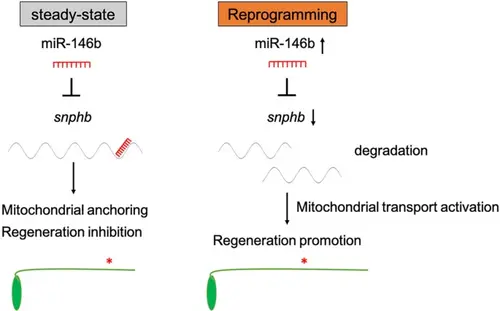
Reprogramming miR-146b-snphb signaling activates axonal mitochondrial transport in zebrafish M-cell and promotes axon regeneration after injury |