
Fig. 5
- ID
- ZDB-FIG-250506-5
- Publication
- Wang et al., 2024 - Reprogramming miR-146b-snphb Signaling Activates Axonal Mitochondrial Transport in the Zebrafish M-cell and Facilitates Axon Regeneration After Injury
- Other Figures
- All Figure Page
- Back to All Figure Page
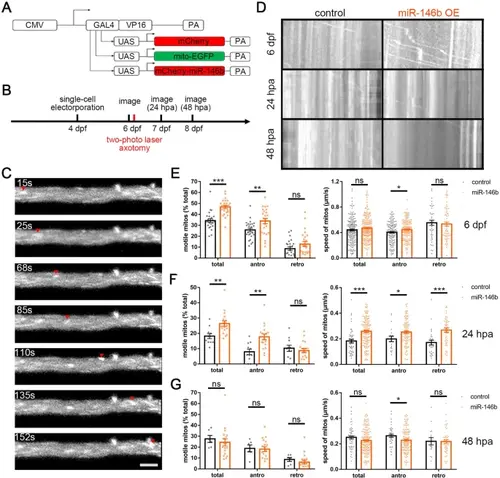
Reprogramming miR-146b-snphb signaling activates M-cell axonal mitochondrial transport. A Schematic diagram of miR-146b overexpression system and mitochondrial tracer vector. UAS-mito-EGFP: plasmid that labels mitochondria with EGFP signaling. B Time-point diagram of mitochondrial dynamic imaging and axotomy. C Representative images of moving mitochondria tracked by in vivo time-lapse confocal imaging in the M-cell axon (arrowheads trace a motile mitochondrion). Scale bar, 5 μm. D Kymographs depict mitochondrial movement at 6 dpf, 24 hpa, and 48 hpa in the control and miR-146b OE group. E Reprogramming miR-146b signaling resulted in an increase in the proportion of motile mitochondria in the M-cell and the velocity of mitochondria moving in the anterograde direction at 6 dpf. Total: control: 34.35% ± 1.70% vs. miR-146b: 46.73% ± 1.51%, *** P < 0.001; antro: control: 25.72% ± 1.75% vs. miR-146b: 33.90% ± 2.45%, ** P < 0.01; retro: control: 8.63% ± 1.59% vs. miR-146b: 12.83% ± 2.31%. Velocity: total: control: 0.44 ± 0.015 μm/s, n = 194 mitos vs. miR-146b: 0.47 ± 0.012 μm/s, n = 232 mitos; antro: control: 0.404 ± 0.013 μm/s, n = 147 mitos vs. miR-146b: 0.445 ± 0.012 μm/s, n = 169 mitos, * P < 0.05; retro: control: 0.553 ± 0.04 μm/s, n = 47 mitos vs. miR-146b: 0.534 ± 0.032 μm/s, n = 63 mitos (24 videos of 8 fishes per group). F Overexpression of miR-146b promoted the proportion of mobile mitochondria and the velocity of mitochondria in the M-cell axon at 24 hpa. Total: control: 18.22% ± 1.63% vs. miR-146b: 26.43% ± 1.76%, ** P < 0.01; antro: control: 7.96% ± 1.78% vs. miR-146b: 17.69% ± 1.86%, ** P < 0.01; retro: control: 10.26% ± 2.00% vs. miR-146b: 8.73% ± 1.41%. Velocity: total: control: 0.182 ± 0.014 μm/s, n = 48 mitos vs. miR-146b: 0.258 ± 0.009 μm/s, n = 151 mitos, *** P < 0.001; antro: control: 0.199 ± 0.021 μm/s, n = 20 mitos vs. miR-146b: 0.253 ± 0.010 μm/s, n = 98 mitos, * P < 0.05; retro: control: 0.170 ± 0.019 μm/s, n = 28 mitos vs. miR-146b: 0.268 ± 0.018 μm/s, n = 53 mitos, *** P < 0.001 (control: 11 videos from 4 fishes; miR-146b: 18 videos from 6 fishes). G Overexpression of miR-146b barely affected mitochondrial trafficking of the M-cell axon at 48 hpa. Total: control: 27.54% ± 3.21% vs. miR-146b: 24.41% ± 3.28%; antro: control: 18.84% ± 3.14% vs. miR-146b: 18.18% ± 2.26%; retro: control: 8.69% ± 1.79% vs. miR-146b: 6.23% ± 1.74%. Velocity: total: control: 0.250 ± 0.013 μm/s, n = 52 mitos vs. miR-146b: 0.225 ± 0.007 μm/s, n = 162 mitos; antro: control: 0.263 ± 0.013 μm/s, n = 37 mitos vs. miR-146b: 0.223 ± 0.009 μm/s, n = 119 mitos, * P < 0.05; retro: control: 0.220 ± 0.029 μm/s, n = 15 mitos vs. miR-146b: 0.218 ± 0.015 μm/s, n = 44 mitos (control: 6 videos from 2 fishes; miR-146b: 18 videos from 6 fishes). |