
Fig. 2
- ID
- ZDB-FIG-250506-2
- Publication
- Wang et al., 2024 - Reprogramming miR-146b-snphb Signaling Activates Axonal Mitochondrial Transport in the Zebrafish M-cell and Facilitates Axon Regeneration After Injury
- Other Figures
- All Figure Page
- Back to All Figure Page
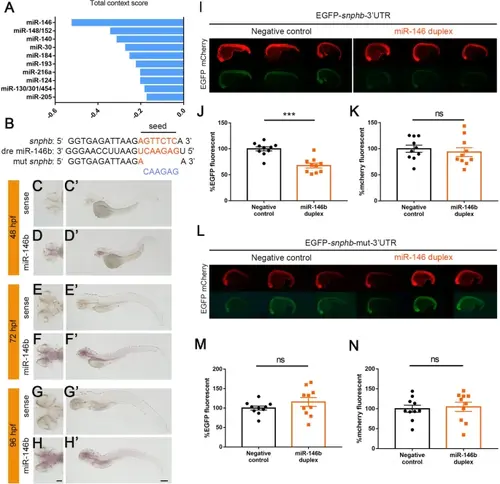
miR-146b targets snphb in vivo. A Total context score of potential upstream miRNAs for snphb (only the top 10 miRNAs were displayed). The smaller the score, the more likely it is to be involved in the regulation of snphb. B Sequence alignment of zebrafish miR-146b, snphb 3'-UTR, and its mutation. Seed sequences were highlighted in orange and mutation sequences were shown in blue. C–H Expression patterns of miR-146b in zebrafish larvae (scale bar, 100 μm). C’–H’ Localization of miR-146b in larval brains (scale bar, 200 μm). The dorsal and lateral views at different stages revealed that miR-146b is expressed throughout the CNS, similar to the snphb expression pattern. I–K EGFP-snphb 3'-UTR fluorescent signals attenuated when miR-146b duplex was co-injected compared to nonsense duplex (as negative control). There was no significant change in fluorescence signals of the mCherry mRNA (as control). EGFP and mCherry fluorescence were shown as a percentage of the fluorescent signals recorded from the negative control. EGFP signals: negative control: 100.00% ± 3.981%; miR-146b duplex: 67.71% ± 4.507%, *** P < 0.001; mCherry signals: negative control: 100.00% ± 6.809%; miR-146b duplex: 93.67% ± 8.502%. L–N There was no significant change in both EGFP-snphb 3'-UTR and mCherry fluorescent signals after seed sequences mutation, regardless of the injection of nonsense or miR-146b duplex. EGFP and mCherry fluorescence were shown as a percentage of the fluorescent signals recorded from the negative control. EGFP signals: negative control: 100.00% ± 5.237%; miR-146b duplex: 115.7% ± 11.370%; mCherry signals: negative control: 100.00% ± 8.97%; miR-146b duplex: 104.7% ± 11.62%. Error bars indicate SEM. |