
|
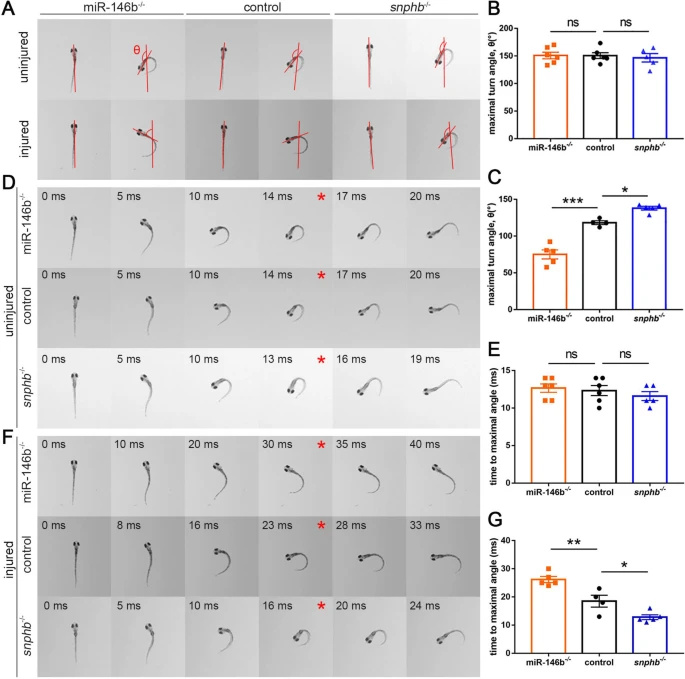
Fig. 6 Escape response tests showed the positive effect of the miR-146b-snphb axis on M-cell function recovery. A Representative images of initial orientation and maximal turn angle of zebrafish larvae in the uninjured and injured groups. Red lines indicate the orientation before and after the escape behavior. B, C Statistical analysis of the maximal turn angle. Uninjured: control: 150.7 ± 5.3°; miR-146b-/-: 151.0 ± 6.0°; snphb-/-: 146.8 ± 7.6°; ns, not significant. Injured: control: 118.4 ± 2.6°; miR-146b-/-: 75.08 ± 6.1°, *** P < 0.001; snphb-/-: 138.1 ± 2.5°, * P < 0.05. Assessed by ordinary one-way ANOVA/Tukey’s multiple-comparisons test. Error bars indicate SEM. D A series of images from the escape behavior of zebrafish larvae in the uninjured and injured groups. Red asterisks indicate the maximal turn angle. E, F Statistical analysis of the time to maximal turn angle. Uninjured: control: 12.33 ± 0.7 ms; miR-146b-/-: 12.67 ± 0.6 ms; snphb-/-: 11.6 ± 0.6 ms; ns, not significant. Injured: control: 18.5 ± 2.1 ms; miR-146b-/-: 26.2 ± 1.1 ms, ** P < 0.01; snphb-/-: 12.8 ± 0.9 ms, * P < 0.05. Assessed by ordinary one-way ANOVA. Error bars indicate SEM.