
- Title
-
tp53 R217H and R242H mutant zebrafish exhibit dysfunctional p53 hallmarks and recapitulate Li-Fraumeni syndrome phenotypes
- Authors
- Kobar, K., Tuzi, L., Fiene, J.A., Burnley, E., Galpin, K.J.C., Midgen, C., Laverty, B., Subasri, V., Wen, T.T., Hirst, M., Moksa, M., Carles, A., Cao, Q., Shlien, A., Malkin, D., Prykhozhij, S.V., Berman, J.N.
- Source
- Full text @ BBA Molecular Basis of Disease

The fold change of expression of several p53 target genes following induction of the DNA damage pathway is decreased in tp53 mutants. Thirty 24 hpf embryos per sample were exposed to 0 or 30 Gy of IR and were collected at 30 hpf (6 hpi). Expression of puma was not detected in the 0 Gy tp53 null embryos and expression of tp53 was not detected in the 0 nor 30 Gy tp53 null groups. Data represents 2–4 technical replicates and 3–4 biological replicates. The fold change was normalized to the wildtype 0 Gy group for each gene. Outliers were identified and excluded using Grubbs' test with alpha <0.05. Statistical significance was determined by a two-way ANOVA and a Tukey's Honest Significant Difference test. Error bars represent standard deviation. The Y-axis is logarithmic scale 10. |
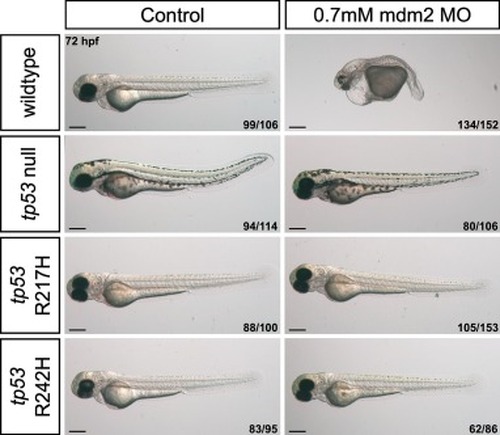
mdm2 MO-injected mutant tp53 embryos are resistant to mdm2 loss-associated phenotypes due to mutant p53 LOF. Single cell embryos were injected with 0.7 mM of a splice-blocking mdm2 morpholino. Images were captured at 72 hpf. Representative images shown for each group as described by ratio in bottom right corner of each image, from four independent experiments. Scale bars, 300 μm. |
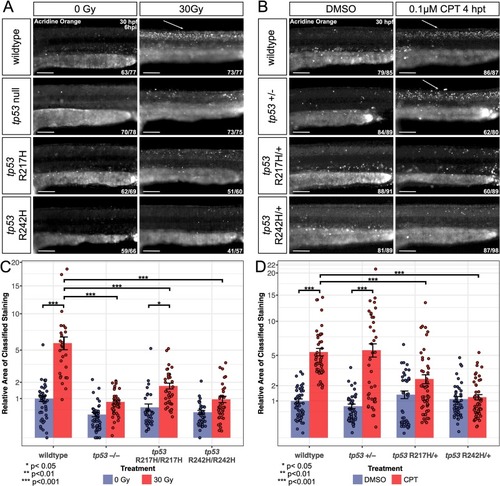
tp53 zebrafish mutant embryos exhibit partial-to-full resistance to apoptosis and point mutants exhibit dominant negative activity following induction of the DNA damage pathway. (A) Embryos were exposed to ±30 Gy of IR at 24 hpf and stained with AO at 6 hpi. (B) 26 hpf embryos were treated with 0.1 μM CPT or DMSO for 4 h and stained with AO at 30 hpf. The white arrows highlight the typical apoptotic pattern observed along the dorsal spine. Images are of the dorsal spine above the yolk extension. Representative images shown for each group as described by the ratio in bottom right corner of each image. n = 3 replicates. Scale bars, 100 μm. (C, D) Bar graphs showing quantification of the relative area of apoptotic cells in the dorsal neural progenitor region as determined using an ilastik Cell Profiler pixel classifier for the homozygotes (C) and heterozygotes (D). The number of embryos used for analysis in each group is listed in (A) for (C) and in (B) for (D). Statistical significance was determined by a two-way ANOVA and a Tukey's Honest Significant Difference test as shown by stars. Error bars represent standard error. The Y-axis scale is square root. |
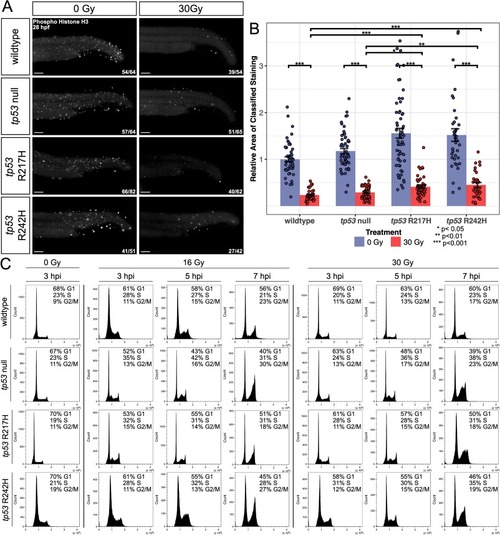
tp53 mutant embryos display increased proliferating cells and defective cell cycle checkpoints following IR compared to wildtype. (A) Immunofluorescence for pH3 performed on 28 hpf (3 hpi) embryos ±30 Gy. Representative images shown for each group as described by ratio in bottom right corner of each image. n = 3 replicates. (B) Bar graphs showing quantification of the relative area of pH3 positive cells in the tail region as determined using an ilastik Cell Profiler pixel classifier. The number of embryos used for analysis in each group is listed in (A). Statistical significance was determined by a two-way ANOVA and a Tukey's Honest Significant Difference test as shown by stars. Error bars represent standard error. (C) Flow cytometry histograms of DNA content in each cell cycle phase (G1, S, G2/M) at 3, 5, and 7 hpi dosed with 0, 16 or 30 Gy in wildtype, tp53 null, R217H/R217H, and R242H/R242H embryos. Embryos were enzymatically dissociated, fixed, permeabilized, and stained with FxCycle violet. Each plot was gated to 25,000 cells (±100 cells). Results and G1, S, and G2/M phase percentages are representative of three independent experiments. Scale bars, 100 μm. |
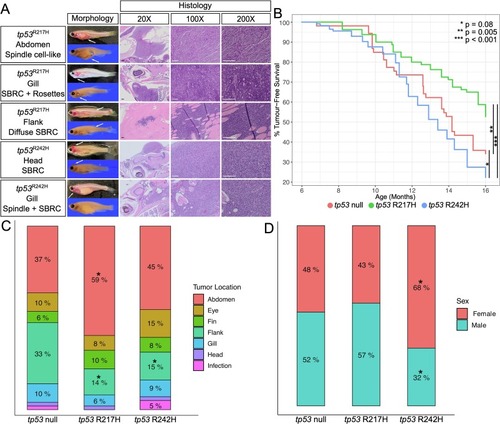
LFS zebrafish mutants develop sarcoma-like tumors with a divergent anatomical distribution of tumor development and higher lifetime tumor incidence in the tp53 R242H/R242H mutants. (A) Live and fixed morphology of tp53 mutant tumors, indicated by white arrows, and histology panels represent H&E stained sections of the anatomical area of the tumor. (B) Kaplan-Meier analysis showing tumor-free survival and onset in the tp53 null (n = 52), R217H/R217H (n = 77), and R242H/R242H (n = 112). Stars show significance as tp53 null vs. R217H/R217H — p = 0.005, tp53 null vs. R242H/R242H — p = 0.08, R217H/R217H vs. R242H/R242H — p = 1 × 10⁻⁷. Percent tumor-free survival refers to the age a specific fish had died or was euthanized due to tumor development. Tumor development was not observed in the wildtype line during this time period. Scale bars for 20× are 200 μm. Scale bars for 100× and 200× are 100 μm. (C) Comparison of anatomical site of tumor development in tp53 null (n = 51), R217H/R217H (n = 49), and R242H/R242H (n = 117) that developed tumors. The infection category represents fish with severe infection phenotypes (dropsy and edema) and may indicate the presence of a leukemia/lymphoma. A “*” above the percentage indicates a significant difference compared to tp53 null (p < 0.05 — two-tailed two proportions Z-test). (D) Comparison of tumor fish sex across the tp53 null (n = 52), R217H/R217H (n = 46), and R242H/R242H (n = 111) mutants. A “*” above the percentage indicates a significant difference compared to tp53 null (p < 0.05 — two-tailed two proportions Z-test). |

IR treatment impacts gene expression in wildtype but not tp53 mutant embryos while under control conditions. Wildtype, tp53 null, R217H/R217H, and R242H/R242H mutants have largely varying DEGs and GO terms affecting metabolism, biosynthesis and developmental processes, and cell signalling. (A) Heatmap of p53 target genes that were differentially expressed between 0 and 30 Gy conditions across all genotype/treatment samples (adjusted p-value < 0.05, fold change >2). Genes that were also measured by qPCR in Fig. 2 are listed in red. (B) A heatmap of all differentially expressed genes from all genotype/treatment group comparisons (adjusted p-value < 0.05, fold change >2). (C) A heatmap showing DEGs from all genotype comparisons from the 0 Gy treatment groups (adjusted p-value < 0.05, fold change >2). (D) UpSet plot shows the number and overlap of DEGs between each genotype from the 0 Gy treatment groups. The total number of DEGs per set is shown on the x-axis and the y-axis shows the intersection of DEGs for each comparison. Comparisons with an intersection of less than ten are not shown. (E, F) Dot plots showing the top ten GO BP (E) and KEGG pathway terms (F), ranked by combined score, for each comparison under control conditions. Dot size corresponds to the ratio of DEGs per total number of genes for each term and the colour corresponds to the combined score. (For interpretation of the references to colour in this figure legend, the reader is referred to the web version of this article.) |

DNA methylation changes in tp53 mutant zebrafish affects cell signalling, metabolic processes, and biological macromolecule synthesis and degradation. A) Primary component analysis (PCA) plot shows clustering of the bulk WGBS wildtype, tp53 null, R217H/R217H and R242H/R242H pooled 5 dpf zebrafish samples. B) Dichotomous diagram of the WGBS samples using the Ward clustering method with a correlation distance method. C) Heatmap showing the percent methylation of 150 DMRs identified from 1000 bp windows with an FDR < 0.05 and a methylation differences of >25 %. D) Dot plots showing the top ten GO BP (D) and KEGG pathway (E) terms, ranked by combined score, between each genotype comparison. Enrichment analysis was performed on 226 genes that were associated with the 150 DMRs. Dot size corresponds to the ratio of associated genes per total number of genes for each term and the colour corresponds to the combined score. |
Reprinted from Biochimica et biophysica acta. Molecular basis of disease, 1871, Kobar, K., Tuzi, L., Fiene, J.A., Burnley, E., Galpin, K.J.C., Midgen, C., Laverty, B., Subasri, V., Wen, T.T., Hirst, M., Moksa, M., Carles, A., Cao, Q., Shlien, A., Malkin, D., Prykhozhij, S.V., Berman, J.N., tp53 R217H and R242H mutant zebrafish exhibit dysfunctional p53 hallmarks and recapitulate Li-Fraumeni syndrome phenotypes, 167612167612, Copyright (2024) with permission from Elsevier. Full text @ BBA Molecular Basis of Disease