FIGURE SUMMARY
Title

Receptor tyrosine kinase inhibition leads to regression of acral melanoma by targeting the tumor microenvironment

Authors
Smith, E.A., Belote, R.L., Cruz, N.M., Moustafa, T.E., Becker, C.A., Jiang, A., Alizada, S., Prokofyeva, A., Chan, T.Y., Seasor, T.A., Balatico, M., Cortes-Sanchez, E., Lum, D.H., Hyngstrom, J.R., Zeng, H., Deacon, D.C., Grossmann, A.H., White, R.M., Zangle, T.A., Judson-Torres, R.L.
Source
Full text @ J. Exp. Clin. Cancer Res.

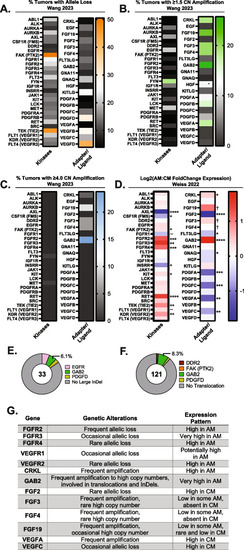
Acral melanoma (AM) tumors highly amplify and/or upregulate RTK adapter proteins, VEGFR, FGFR, and FGF ligands (A) From 88 tumors in the Wang 2023 cohort, the percentage of tumors bearing RTK-associated allele loss, (B) amplification, or (C) high copy-number amplification above 4x background tumor ploidy are shown. D In comparison to CM, AM highly express RTK and intracellular RTK adapters (CRKL and GAB2) per Weiss 2022 [6]. Certain ligands such as FGF3 and FGF19 were expressed at low levels in some AM tumors compared to lack of expression in CM. P-adjusted significance values are indicated as follows: ~ p = 0.05–0.07, * p < 0.05, **p < 0.01, ***p < 0.001, ****p < 0.0001, † low expression gives error in p-value calculations. E Large insertion and deletion (InDel) events and (F) translocation events involving RTK-associated genes occur in a minority of AM per Liang 2017 [84] and Newell 2020 [4]. G A summary of published CNV and expression results for select genes are tabulated

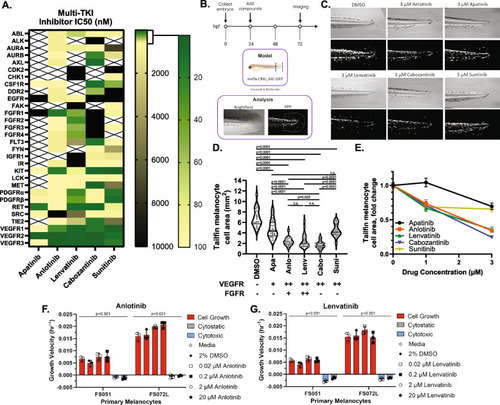
Blockade of FGFR/VEGFR receptors inhibits melanogenesis in a dose-dependent fashion. A Colormap representing the published IC50 values and inferred IC50 values from kinase inhibition studies for five separate multi-RTK inhibitors. B A premalignant mitfa-CRKL and MC-GFP zebrafish model of AM is utilized to test multi-RTK inhibitor effects against fin melanogenesis. C, D Phase contrast and GFP fluorescence imaging of multi-RTK treated zebrafish tails reveal that 3 µM Anlotinib, Cabozantinib, or Lenvatinib induce a marked decrease in fin melanogenesis. Each grey dot in D represents an individual zebrafish. The potency of each drug against VEGFRs or FGFRs is summarized underneath the x-axis: (+) potent against only one FGFR or VEGFR protein, (+ +) potent against all FGFR or VEGFR proteins, (-) not potent. E Tailfin melanocyte cell area quantification at different drug doses in mitfa-CRKL MC-GFP zebrafish. Similar doses of (F) Anlotinib and (G) Lenvatinib have intrinsic cytotoxic effects on cultured primary human melanocytes (see also Figure S1E). Drug abbreviations: Apa – Apatinib, Anlo – Anlotinib, Lenv – Lenvatinib, Cabo – Cabozantinib, Suni – Sunitinib

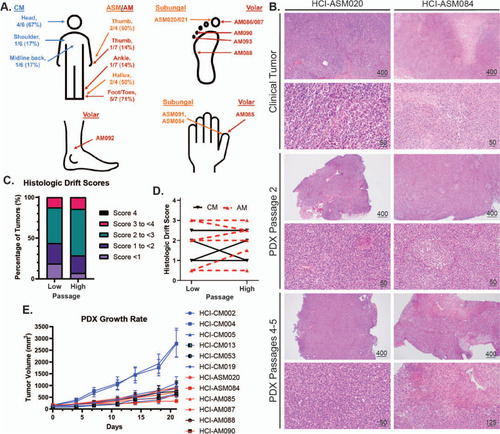
Histologic and tumor growth rate characterization of AM and CM PDX tumor models. A Anatomic location of AM and CM tumors. CM are labelled in blue text, acral subungal melanoma (ASM) in orange, and volar AM in red. B Representative clinical, low-passage, and high passage PDX tumor histology images. C-D Results from the Clinical Drift Score validation indicates that PDX tumors are histologically stable through multiple passages. Scores represent cytologic and histologic architecture drift from the original clinical tumor histology: none/identical (0), minimal (1), mild (2), moderate (3), and marked (4). Definitions and criteria for each classification are available in Supplemental Data 3. Four CM tumors and nine AM tumors are plotted in C-D. E Growth rates of representative PDX tumors

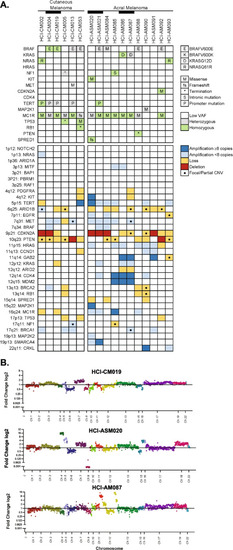
Genetic characterization of AM and CM PDX tumor models. A Available AM PDX models encompass the spectrum of TCGA MAPK mutations. Relevant Tier I (pathogenic) and II (likely pathogenic) SNV mutations, MC1R mutations associated with melanoma predisposition, and CNV are represented in the tile plot. Black bars link PDX tumors that were collected from the same patient. B AM PDX models with localized highly amplified genomic regions are compared to a representative CM model

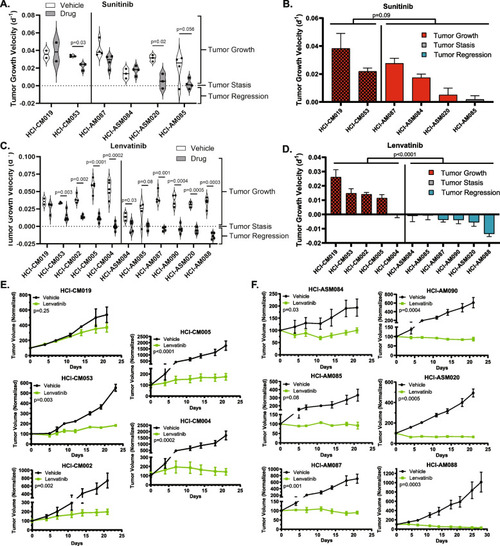
Dual FGFR/VEGFR inhibition with Lenvatinib induces tumor stasis or regression in all AM PDX tumors. Tumor growth velocity for individual Sunitinib (daily, 40 mg/kg) and Lenvatinib (daily, 50 mg/kg) treated PDX tumors are represented as violin plots (A, C). The Lenvatinib-treated tumors from (A, C) are shown as bar plots that are color-coded based on depth of response (B, D). CM tumors are indicated by a checkerboard pattern. Average tumor growth of vehicle and Lenvatinib treated CM (E) and AM (F) are shown for all of the tested PDX models. Two-way ANOVA was used to determine differences between CM and AM therapy response (B-D), and student T-tests were used to compare vehicle and treatment differences within a PDX model (A, C, EF)

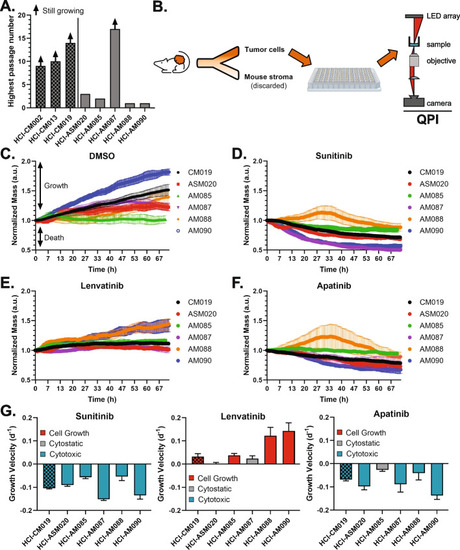
Dual FGFR/VEGFR is not directly cytotoxic in dissociated AM PDX tumor cells. A Most AM cells cultured from PDX tumors do not grow in extended culture conditions. B Fresh PDX tumors were collected, dissociated into individual cells, and depleted of mouse stroma before plating for immediate and short term culture drug studies using quantitative phase imaging (QPI). Growth of AM and CM cells in (C) 0.5% DMSO; D 50 µM Sunitinib, E, 20 µM Lenvatinib, and (F) 40 µM Apatinib. G To facilitate comparison to PDX tumor growth velocity in Figs. 4B and D, growth velocity was calculated by linear regression of normalized mass

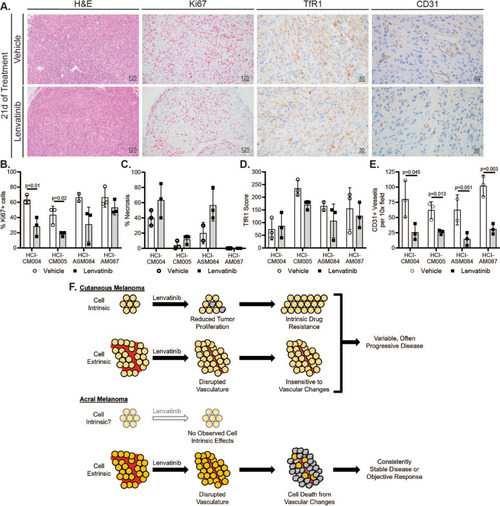
Lenvatinib halts AM tumor growth or induces regression by remodeling tumor vasculature. A Representative histology (H&E, 10 × objective) and immunohistochemistry (IHC) images of vehicle and Lenvatinib HCI-AM087 are shown. CD31 (20x objective) and transferrin receptor 1 (TfR1, 40x objective) were stained with DAB, and MiB/Ki67 (10x objective) was stained with red chromogen. Scale bars are in microns. A pathologist quantified the B Ki67 IHC positive cell percentage, C percent necrosis from H&E-stained sections, D membranous TfR1 IHC scores, and E CD31 positive IHC vessels. Significance was determined using the Student’s t-test. F While CM has reduced tumor proliferation and diminished blood vessel quantity and quality on Lenvatinib therapy, these PDX tumors often continue to grow. There are no observed direct cytotoxic effects of Lenvatinib on AM cells. Instead, tumor regression or stable disease is achieved in AM tumors by reducing the blood vessel quantity and quality

Acknowledgments
This image is the copyrighted work of the attributed author or publisher, and ZFIN has permission only to display this image to its users. Additional permissions should be obtained from the applicable author or publisher of the image. Full text @ J. Exp. Clin. Cancer Res.