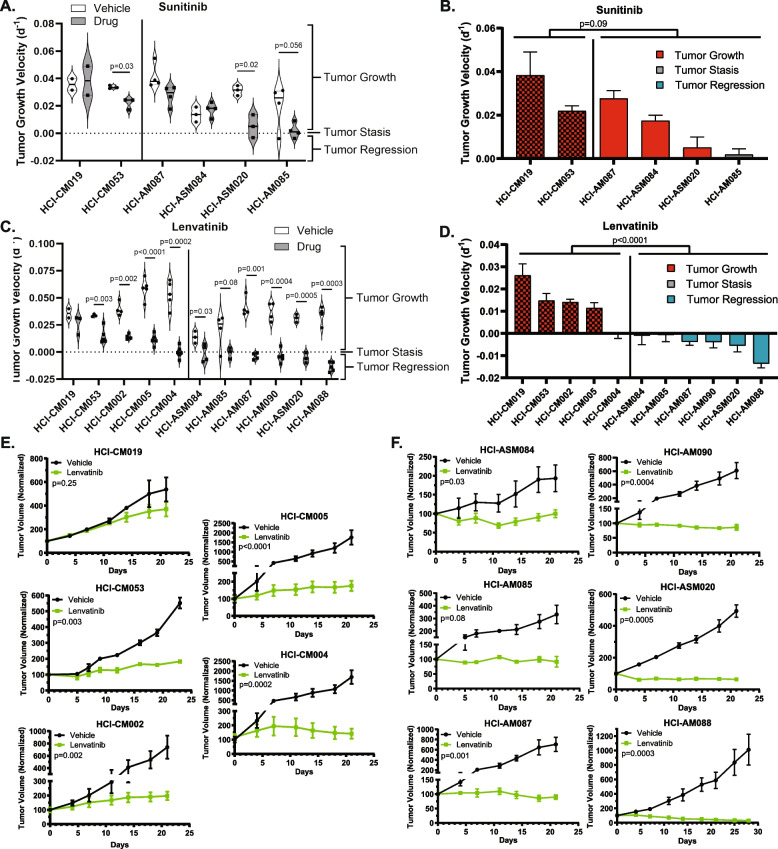
IMAGE

Fig. 5

ID
ZDB-IMAGE-241206-6
Source
Figures for Smith et al., 2024
Image
Figure Caption

Fig. 5

Dual FGFR/VEGFR inhibition with Lenvatinib induces tumor stasis or regression in all AM PDX tumors. Tumor growth velocity for individual Sunitinib (daily, 40 mg/kg) and Lenvatinib (daily, 50 mg/kg) treated PDX tumors are represented as violin plots (A, C). The Lenvatinib-treated tumors from (A, C) are shown as bar plots that are color-coded based on depth of response (B, D). CM tumors are indicated by a checkerboard pattern. Average tumor growth of vehicle and Lenvatinib treated CM (E) and AM (F) are shown for all of the tested PDX models. Two-way ANOVA was used to determine differences between CM and AM therapy response (B-D), and student T-tests were used to compare vehicle and treatment differences within a PDX model (A, C, EF)

Acknowledgments
This image is the copyrighted work of the attributed author or publisher, and ZFIN has permission only to display this image to its users. Additional permissions should be obtained from the applicable author or publisher of the image. Full text @ J. Exp. Clin. Cancer Res.