IMAGE

Fig. 2

ID
ZDB-IMAGE-241206-3
Source
Figures for Smith et al., 2024
Image
Figure Caption

Fig. 2

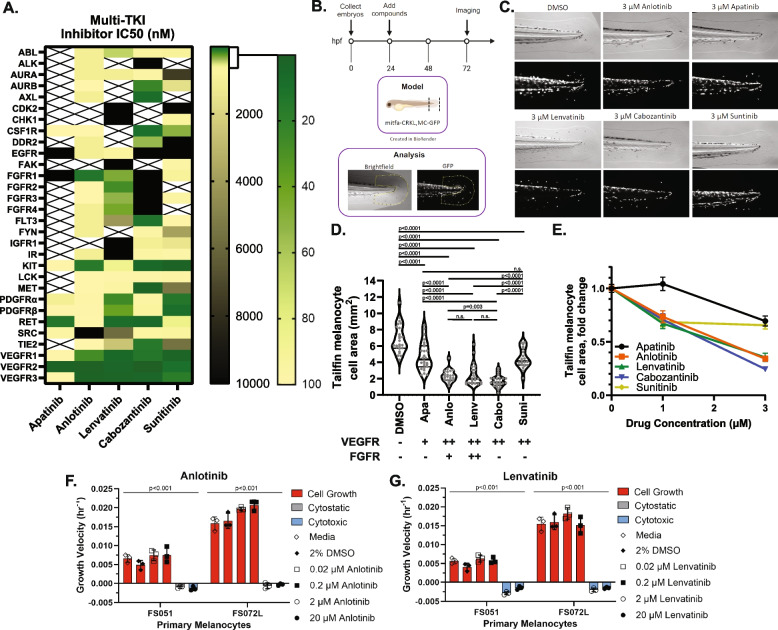
Blockade of FGFR/VEGFR receptors inhibits melanogenesis in a dose-dependent fashion. A Colormap representing the published IC50 values and inferred IC50 values from kinase inhibition studies for five separate multi-RTK inhibitors. B A premalignant mitfa-CRKL and MC-GFP zebrafish model of AM is utilized to test multi-RTK inhibitor effects against fin melanogenesis. C, D Phase contrast and GFP fluorescence imaging of multi-RTK treated zebrafish tails reveal that 3 µM Anlotinib, Cabozantinib, or Lenvatinib induce a marked decrease in fin melanogenesis. Each grey dot in D represents an individual zebrafish. The potency of each drug against VEGFRs or FGFRs is summarized underneath the x-axis: (+) potent against only one FGFR or VEGFR protein, (+ +) potent against all FGFR or VEGFR proteins, (-) not potent. E Tailfin melanocyte cell area quantification at different drug doses in mitfa-CRKL MC-GFP zebrafish. Similar doses of (F) Anlotinib and (G) Lenvatinib have intrinsic cytotoxic effects on cultured primary human melanocytes (see also Figure S1E). Drug abbreviations: Apa – Apatinib, Anlo – Anlotinib, Lenv – Lenvatinib, Cabo – Cabozantinib, Suni – Sunitinib

Acknowledgments
This image is the copyrighted work of the attributed author or publisher, and ZFIN has permission only to display this image to its users. Additional permissions should be obtained from the applicable author or publisher of the image. Full text @ J. Exp. Clin. Cancer Res.