
- Title
-
Real-time imaging reveals a role for macrophage protrusive motility in melanoma invasion
- Authors
- Ramakrishnan, G., Miskolci, V., Hunter, M., Giese, M.A., Münch, D., Hou, Y., Eliceiri, K.W., Lasarev, M.R., White, R.M., Huttenlocher, A.
- Source
- Full text @ J. Cell Biol.
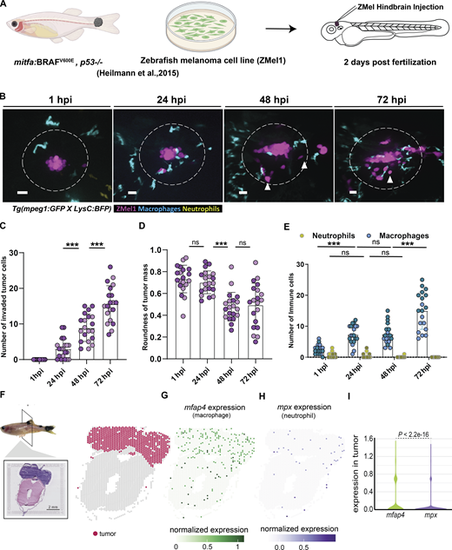
Macrophages accumulate near melanoma cells. (A) Schematic showing the larval zebrafish melanoma model. Zmel1 cells were injected into 2 dpf zebrafish larvae Tg(mpeg1:GFP, LysC:BFP) and imaged from 1 to 72 hours post injection (hpi). (B) Representative images of the melanoma tumor microenvironment (TME) from 1 to 72 hpi. Arrows indicate invaded tumor cells. The dotted circle indicates the region of immune cell quantification. (C) Quantification of the number of invaded tumor cells over time. (D) Quantification of the roundness of the tumor mass over time. (E) Quantification of neutrophils and macrophages within 50 µm distance from the periphery of the tumor cluster. n = 19 larvae from two independent experiments. Scale bar 20 µm. *P < 0.05, **P < 0.01, ***P < 0.001. (F) Image of zebrafish with BRAFV600E used for spatial transcriptomics in Hunter et al. (2021), Visium array spots color-coded to indicate the tumor region. (G and H) The expression of mfap4 (macrophage marker) and mpx (neutrophil marker) projected over tissue space. (I) Quantification of spatial gene expression in the tumor regions from three different tissue sections. Significance was calculated by Wilcoxon sum rank test. |

Macrophages mediate invasive migration of melanoma cells. (A) Representative stills from time-lapse imaging of tumor-macrophage interactions between 24 and 36 hpi acquired every 5 min (Video 1). (B) Representative stills of tumor-macrophage interactions that precede tumor invasion. (C) Quantification of length of macrophage protrusions during macrophage contact with invading tumor cell compared to macrophages that do not contact the invading tumor cell. n = 5 larvae; 27 contact cells and 25 non-contact cells from three independent experiments. Quantifications were made in a single frame prior to each invasion event. (D) Schematic of sequence of larvae injections. 2 dpf larvae were injected with L-PBS or L-Clodronate through the caudal vein followed by ZMel1 injection into the hindbrain ventricle 2 h later. (E) Representative images from time course imaging of L-PBS or L-Clodronate injected larvae from 1 to 48 hpi. (F) Quantification of macrophage recruitment at 24 and 48 hpi. (G) Quantification of the number of invaded tumor cells at 48 hpi. (H) Quantification of fold change in 3D tumor area from 1 to 48 hpi. (I) Quantification of roundness of tumor cell cluster at 48 hpi. n = 30 larvae L-PBS, n = 28 larvae L-Clodronate from three independent experiments. Scale bar = 20 µm. *P < 0.05, **P < 0.01, ***P < 0.001. |
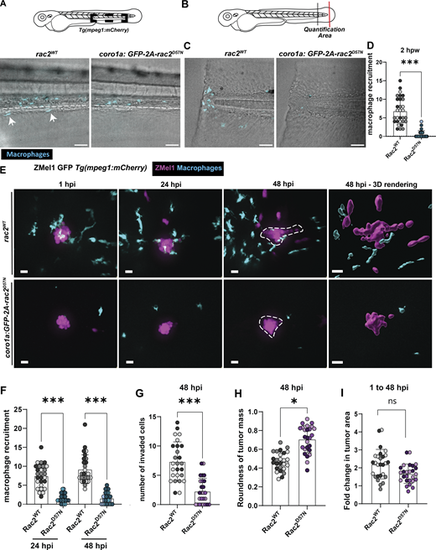
Rac2 signaling in macrophages is required for macrophage recruitment to the TME and tumor invasion. (A) Representative images of macrophages in the caudal hematopoietic tissue of 3 dpf wild-type larvae or Tg(coro1a:GFP-rac2 D57N)psi92T larvae. (B) Schematic of a 3 dpf larvae to highlight the tail transection region (red line) and the quantification area for macrophage recruitment (between red and black line). (C) Representative images of the tail fin of wild-type or Rac2D57N larvae wounded and imaged 2 h post wound. (D) Quantification of macrophage recruitment to tail fin. n = 30 wild-type, n = 27 Rac2D57N from three independent replicates. (E) Representative images from time course imaging of wild-type or Rac2D57N larvae injected with Zmel1 GFP cells from 1 hpi to 48 hpi. (F) Quantification of macrophage recruitment to tumor at 24 and 48 hpi. (G) Quantification of number of invaded tumor cells at 48 hpi. (H) Quantification of tumor roundness at 48 hpi. (I) Quantification of fold change in tumor area from 1 to 48 hpi. n = 26 wild-type, n = 26 Rac2D57N from three independent replicates. Scale bar = 20 µm. *P < 0.05, **P < 0.01, ***P < 0.001, n.s., not significant. |
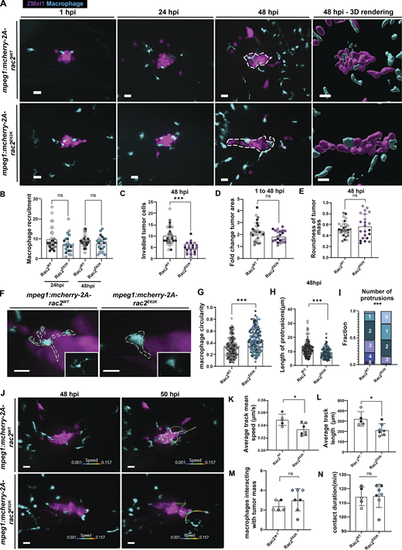
Hyperactivation of Rac2 alters macrophage morphology and motility in the TME. (A) Representative images from the time course of larvae expressing mpeg1:mCherry-2A-rac2WT, mpeg1:mCherry-2A-rac2E62K injected with ZMel1 cells at 2 dpf. (B) Quantification of macrophage recruitment to tumor cells at 24 and 48 hpi. (C) Quantification of the number of invaded tumor cells at 48 hpi. (D) Quantification of roundness of tumor cell cluster at 48 hpi. (E) Quantification of fold change in tumor area from 1 to 48 hpi. Rac2WT (n = 28 larvae), Rac2E62K (n = 23 larvae) from three independent experiments. (F) Zoom-in images of macrophages highlighting protrusions into the tumor mass in Rac2WT and Rac2E62K-expressing larvae. (G–I) Quantification of circularity, length of protrusions and number of protrusions for macrophages at 48 hpi. Number of cells: Rac2WT = 161 cells, Rac2E62K = 145 cells. (J) Representative images from time-lapse imaging of tumor-macrophage interactions at 48 hpi (Video 3). Tracks indicate macrophage motility around the tumor cells color-coded by instantaneous speed. (K) Quantification of average track mean speed of macrophages from each larva. (L) Quantification of average track length from macrophages in each larva. (M) Quantification of the number of macrophages that interact with the tumor mass in the time course. (N) Quantification of duration of contact of macrophages with the tumor mass in the time course. Rac2WT (n = 5 larvae; 12 cells), Rac2E62K (n = 7 larvae, 21 cells) from three independent experiments. Scale bar = 20 µm. *P < 0.05, **P < 0.01, ***P < 0.001. |

Macrophages accumulate and extend protrusions into the tumor mass correlated with tumor invasion. (A) Representative stills from time-lapse imaging of ZMel1 transplanted larvae from 1 to 6 hpi. (B) Quantification of neutrophils and macrophages every hour from 1 to 6 hpi indicated by average values at each time point. n = 4 larvae. (C) Representative z-projected stills from LSM imaging of tumor-macrophage interactions at 48 hpi imaged every minute. Lines indicate macrophage protrusions and invading tumor cells (n = 4). (D) Quantification of protrusion length of macrophages when in contact with invading tumor versus not in contact from light sheet microscopy (n = 3, from two independent experiments). |
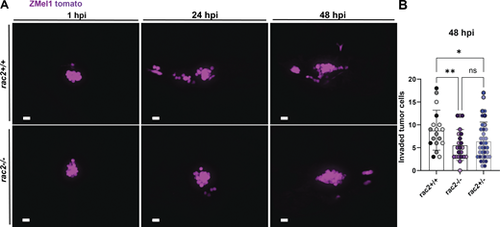
Depletion of Rac2 inhibits tumor invasion. (A) Representative stills from time course imaging of ZMel1 cells after transplantation in rac2+/+ or rac2−/− larvae. (B) Quantification of number of invaded tumor cells in rac2+/+ (n = 18 larvae), rac2−/− (n = 23 larvae) and rac2+/− (n = 37 larvae) from three independent replicates. *P < 0.05, **P < 0.01. Scale bar = 20 µm. |

Effects of Rac2 on tumor invasion and macrophage motility at wounds. (A) Representative stills from time course images of wild-type larvae or larvae expressing mpx:mCherry-2A-rac2D57N injected with ZMel1 cells at 2 dpf. (B) Quantification of the number of invaded tumor cells at 48 hpi. (C) Quantification of macrophage recruitment at 24 and 48 hpi. wild-type (n = 18 larvae), mpx:mCherry-2A-rac2D57N (n = 20 larvae). Scale bar = 20 µm. (D) Representative stills of mpeg1:mCherry-2A-rac2WT or mpeg1:mCherry-2A-rac2E62K expressing larvae at 2 h post wound (hpw), tail transected at 3 dpf. (E) Quantification of macrophage recruitment to wound at 2 hpw. (F) Quantification of circularity of macrophages at the wound. mpeg1:mCherry-2A-rac2WT (n = 21 larvae, 219 cells), mpeg1:mCherry-2A-rac2E62K (n = 22 larvae, 207 cells) from two independent experiments. *P < 0.05, **P < 0.01. |