
Fig. 1
- ID
- ZDB-FIG-241218-90
- Publication
- Ramakrishnan et al., 2025 - Real-time imaging reveals a role for macrophage protrusive motility in melanoma invasion
- Other Figures
- All Figure Page
- Back to All Figure Page
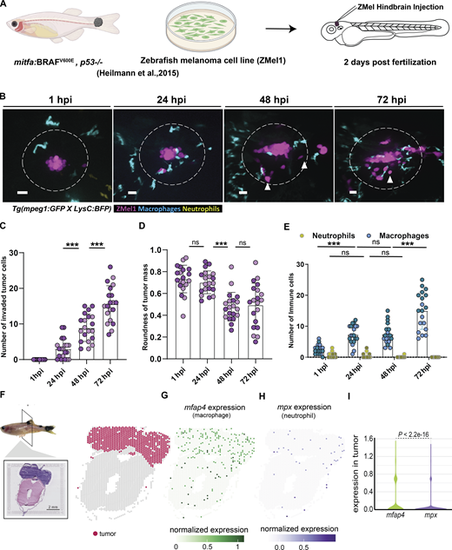
Macrophages accumulate near melanoma cells. (A) Schematic showing the larval zebrafish melanoma model. Zmel1 cells were injected into 2 dpf zebrafish larvae Tg(mpeg1:GFP, LysC:BFP) and imaged from 1 to 72 hours post injection (hpi). (B) Representative images of the melanoma tumor microenvironment (TME) from 1 to 72 hpi. Arrows indicate invaded tumor cells. The dotted circle indicates the region of immune cell quantification. (C) Quantification of the number of invaded tumor cells over time. (D) Quantification of the roundness of the tumor mass over time. (E) Quantification of neutrophils and macrophages within 50 µm distance from the periphery of the tumor cluster. n = 19 larvae from two independent experiments. Scale bar 20 µm. *P < 0.05, **P < 0.01, ***P < 0.001. (F) Image of zebrafish with BRAFV600E used for spatial transcriptomics in Hunter et al. (2021), Visium array spots color-coded to indicate the tumor region. (G and H) The expression of mfap4 (macrophage marker) and mpx (neutrophil marker) projected over tissue space. (I) Quantification of spatial gene expression in the tumor regions from three different tissue sections. Significance was calculated by Wilcoxon sum rank test. |