
|
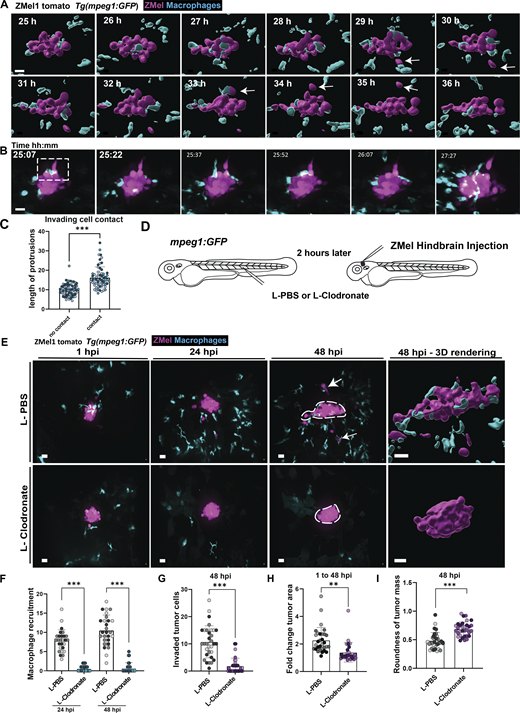
Fig. 2 Macrophages mediate invasive migration of melanoma cells. (A) Representative stills from time-lapse imaging of tumor-macrophage interactions between 24 and 36 hpi acquired every 5 min (Video 1). (B) Representative stills of tumor-macrophage interactions that precede tumor invasion. (C) Quantification of length of macrophage protrusions during macrophage contact with invading tumor cell compared to macrophages that do not contact the invading tumor cell. n = 5 larvae; 27 contact cells and 25 non-contact cells from three independent experiments. Quantifications were made in a single frame prior to each invasion event. (D) Schematic of sequence of larvae injections. 2 dpf larvae were injected with L-PBS or L-Clodronate through the caudal vein followed by ZMel1 injection into the hindbrain ventricle 2 h later. (E) Representative images from time course imaging of L-PBS or L-Clodronate injected larvae from 1 to 48 hpi. (F) Quantification of macrophage recruitment at 24 and 48 hpi. (G) Quantification of the number of invaded tumor cells at 48 hpi. (H) Quantification of fold change in 3D tumor area from 1 to 48 hpi. (I) Quantification of roundness of tumor cell cluster at 48 hpi. n = 30 larvae L-PBS, n = 28 larvae L-Clodronate from three independent experiments. Scale bar = 20 µm. *P < 0.05, **P < 0.01, ***P < 0.001.