
|
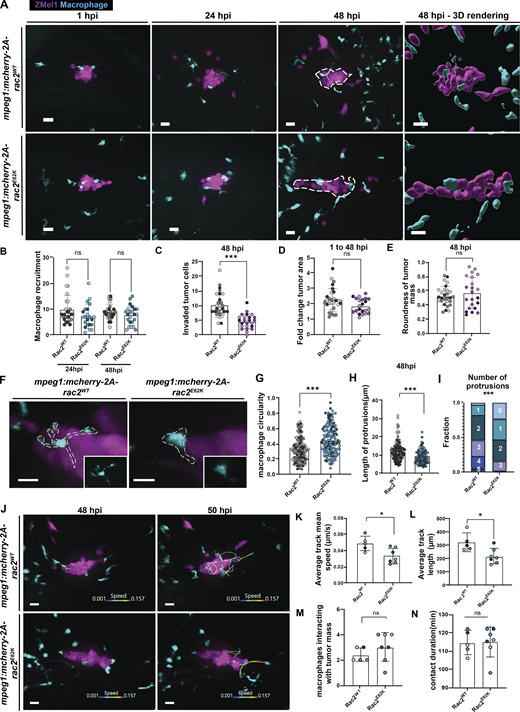
Fig. 4 Hyperactivation of Rac2 alters macrophage morphology and motility in the TME. (A) Representative images from the time course of larvae expressing mpeg1:mCherry-2A-rac2WT, mpeg1:mCherry-2A-rac2E62K injected with ZMel1 cells at 2 dpf. (B) Quantification of macrophage recruitment to tumor cells at 24 and 48 hpi. (C) Quantification of the number of invaded tumor cells at 48 hpi. (D) Quantification of roundness of tumor cell cluster at 48 hpi. (E) Quantification of fold change in tumor area from 1 to 48 hpi. Rac2WT (n = 28 larvae), Rac2E62K (n = 23 larvae) from three independent experiments. (F) Zoom-in images of macrophages highlighting protrusions into the tumor mass in Rac2WT and Rac2E62K-expressing larvae. (G–I) Quantification of circularity, length of protrusions and number of protrusions for macrophages at 48 hpi. Number of cells: Rac2WT = 161 cells, Rac2E62K = 145 cells. (J) Representative images from time-lapse imaging of tumor-macrophage interactions at 48 hpi (Video 3). Tracks indicate macrophage motility around the tumor cells color-coded by instantaneous speed. (K) Quantification of average track mean speed of macrophages from each larva. (L) Quantification of average track length from macrophages in each larva. (M) Quantification of the number of macrophages that interact with the tumor mass in the time course. (N) Quantification of duration of contact of macrophages with the tumor mass in the time course. Rac2WT (n = 5 larvae; 12 cells), Rac2E62K (n = 7 larvae, 21 cells) from three independent experiments. Scale bar = 20 µm. *P < 0.05, **P < 0.01, ***P < 0.001.