
|
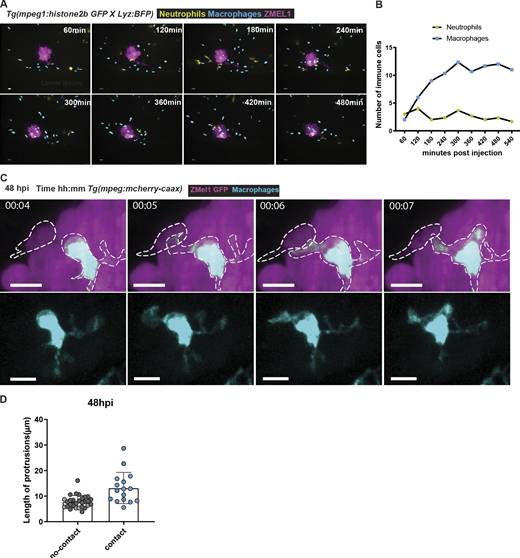
Fig. S1 Macrophages accumulate and extend protrusions into the tumor mass correlated with tumor invasion. (A) Representative stills from time-lapse imaging of ZMel1 transplanted larvae from 1 to 6 hpi. (B) Quantification of neutrophils and macrophages every hour from 1 to 6 hpi indicated by average values at each time point. n = 4 larvae. (C) Representative z-projected stills from LSM imaging of tumor-macrophage interactions at 48 hpi imaged every minute. Lines indicate macrophage protrusions and invading tumor cells (n = 4). (D) Quantification of protrusion length of macrophages when in contact with invading tumor versus not in contact from light sheet microscopy (n = 3, from two independent experiments).