
- Title
-
Folic acid mitigates the developmental and neurotoxic effects of bisphenol A in zebrafish by inhibiting the oxidative stress/JNK signaling pathway
- Authors
- Li, R., Yang, W., Yan, X., Zhou, X., Song, X., Liu, C., Zhang, Y., Li, J.
- Source
- Full text @ Ecotoxicol. Environ. Saf.
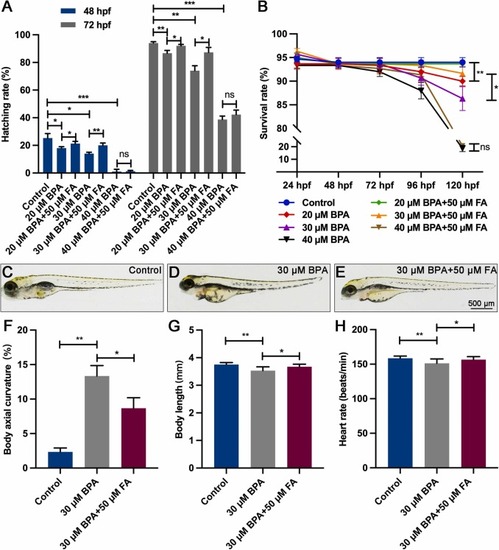
FA can improve the developmental toxic effects induced by BPA exposure in zebrafish embryos or larvae. (A) FA has the potential to enhance the hatchability of zebrafish embryos exposed to BPA. (B) The survival rate of larvae exposed to BPA can be improved by FA. (C-E) The images depict the control group, as well as larvae exposed to 30 µM of BPA alone or in combination with 50 µM of FA at 120 hpf. (F) The proportion of BPA-induced spinal curvature phenotypes in larvae can be alleviated by FA. (G) The phenotype of body length reduction in larvae induced by BPA exposure can be rescued by FA (n=9). (H) FA can mitigate the decreased heart rate phenotype induced by exposure to BPA in larvae (n=9). The significance levels are denoted as follows: *P<0.05; ** P<0.01; *** P<0.001; and "ns" indicates not significant. The error bars in the figures depict the standard error of the mean. |
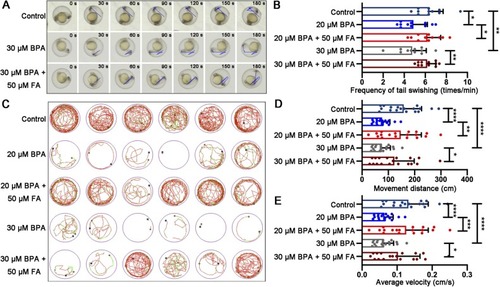
The addition of FA can improve the abnormal movement behaviors of zebrafish embryos or larvae induced by exposure to BPA. (A) A stereo fluorescence microscope was used to record a video of the tail oscillatory movement of zebrafish embryos at 24 hpf. The sequence of pictures shows intervals of 30 seconds. (B) The frequency of tail oscillation was calculated for the 24 hpf embryos. (C) The movement trajectory, (D) total movement distance and (E) average speed of 6dpf larvae within a 10-minute period were also analyzed. Significance levels are denoted as follows: *P<0.05; **P<0.01; ***P<0.001; ****P<0.0001. Error bars represent the standard error of the mean. |
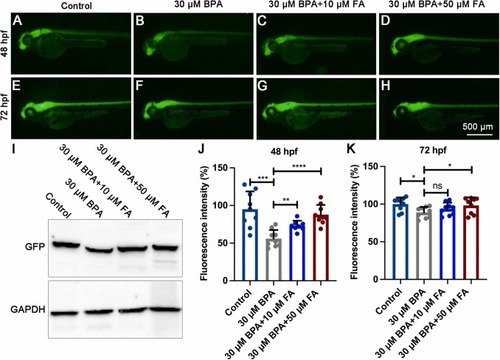
The neuron-specific GFP expression in transgenic tg(elavl3:GFP) zebrafish larvae exposed to BPA was reversed by FA. (A-H) The fluorescence intensity of neuron-specific GFP in the brain and spinal cord was measured at 48 hpf and 72 hpf. (I) Western blot analysis was performed to detect the expression of the GFP protein in transgenic tg(elavl3:GFP) zebrafish larvae at 48 hpf (n=50). (J-K) It was observed that the FA supplementation group significantly reversed the fluorescence intensity (n=9). Significance levels are denoted as follows: *P<0.05; **P<0.01; ***P<0.001; ****P<0.0001. The error bars in the figures indicate the standard error of the mean. |
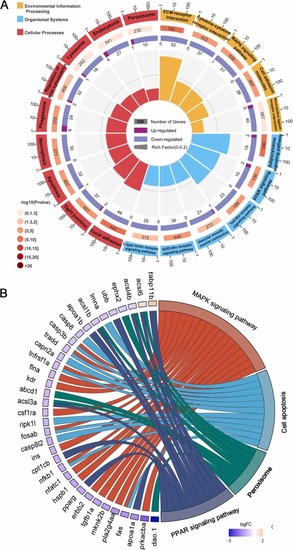
The KEGG enrichment analysis was performed on DEGs in zebrafish larvae at 5 dpf after exposure to BPA and FA supplements, as detected by RNA-seq. (A) The KEGG enrichment circle diagram shows the top 20 enriched pathways in the outer circle, with the number of genes indicated by the coordinates. The second circle represents the background gene count and P value, with longer bars indicating a higher number of genes. The third circle shows the number of DEGs in each pathway, while the innermost circle displays the Rich Factor value for each pathway. (B) The chordal diagram of enriched pathways highlights DEGs related to the MAPK, PPAR, apoptosis, and peroxisome pathways, all of which are associated with the nervous system. |
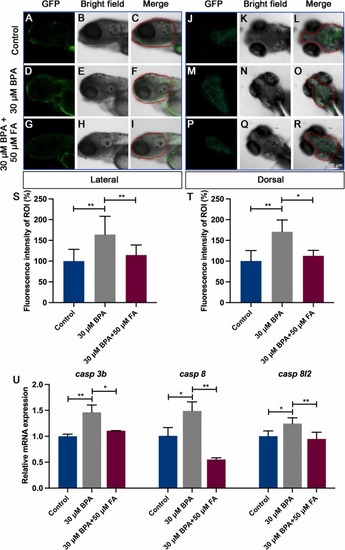
FA can prevent the apoptosis of brain cells caused by BPA in zebrafish larvae. The lateral view (A-I) or dorsal view (J-R) of the brain regions in zebrafish larvae was examined using acridine orange staining to observe the impact of FA on inhibiting BPA-induced apoptosis in zebrafish larvae at 5 dpf. Apoptotic cells were identified by green fluorescence through acridine orange staining. The red dotted area in (C, F, I, L, O, and R) indicates the region of interest (ROI). Quantitative analysis of green fluorescent intensity in the head region of zebrafish larvae was conducted in both lateral view (S) and dorsal view (T). The data were expressed as the mean ± standard error (n = 9). Scale bar: 100 μm. (U) The mRNA expression of relevant genes was verified via qRT-PCR. The data were shown as the mean ± standard error (n = 50), with significance levels denoted as *P<0.05, **P<0.01. |
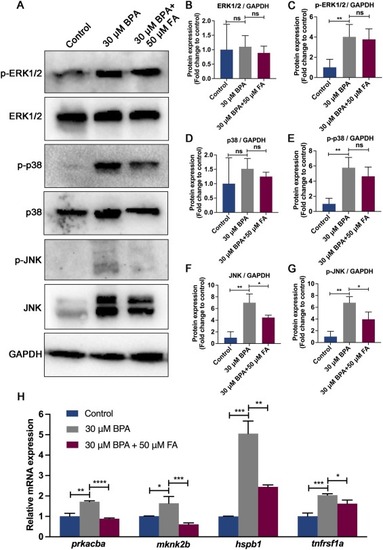
FA supplementation affects the expression of proteins and genes in the MAPK signaling pathway in the presence of BPA. (A) Western blot analysis was performed to detect the expression of MAPK signaling pathway activation-related proteins in 5 dpf zebrafish larvae following exposure to BPA and supplementation with FA. The results of statistical analysis are shown in (B-G). Additionally, mRNA expression of relevant genes in the MAPK signaling pathway was verified using qRT-PCR in (H). The data is shown as mean ± standard error of three replicates (n = 50), with significance levels denoted as *P<0.05, **P<0.01, ***P<0.001, and ***P<0.0001. |
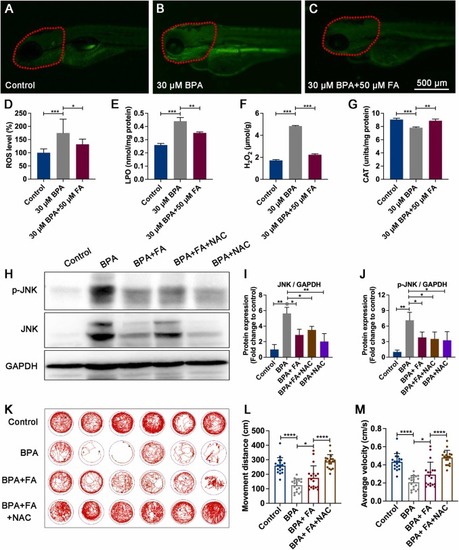
The abnormal motor behavior in zebrafish larvae induced by BPA is alleviated by FA through the ROS/JNK pathway. (A-D) The levels of ROS were measured in zebrafish larvae at 120 hpf using a DCFH-DA fluorescent probe (10 μM). The red dotted regions indicate areas where the fluorescence intensity was statistically analyzed to determine ROS levels (n = 9). (E-G) The levels of LPO (nmol/mg protein), H2O2 (μmol/g), and CAT (units/mg protein) were also measured in zebrafish larvae at 5 dpf (n = 100). (H-J) The inhibitory effects of FA and NAC on the activation of JNK/p-JNK protein levels in zebrafish larvae at 5 dpf were observed (n = 50). BPA, 30 μM; FA, 50 μM; NAC, 5 μM. (K-M) FA and NAC were found to have a synergistic effect in rescuing abnormal motor behavior, movement distance, and average movement speed of zebrafish larvae at 5 dpf after exposure to BPA (n = 18). BPA, 30 μM; FA, 50 μM; NAC, 5 μM. The data are presented as mean ± standard error. Statistical significance was denoted as *P<0.05, **P<0.01, ***P<0.001, and ****P<0.0001. |