
Fig. 4
- ID
- ZDB-FIG-250109-19
- Publication
- Li et al., 2024 - Folic acid mitigates the developmental and neurotoxic effects of bisphenol A in zebrafish by inhibiting the oxidative stress/JNK signaling pathway
- Other Figures
- All Figure Page
- Back to All Figure Page
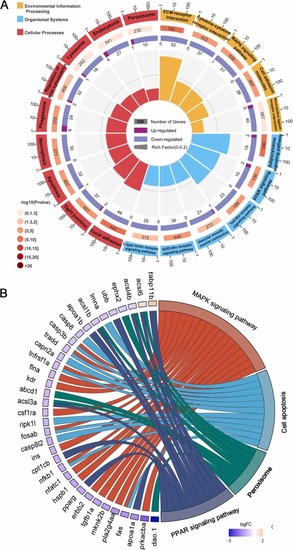
The KEGG enrichment analysis was performed on DEGs in zebrafish larvae at 5 dpf after exposure to BPA and FA supplements, as detected by RNA-seq. (A) The KEGG enrichment circle diagram shows the top 20 enriched pathways in the outer circle, with the number of genes indicated by the coordinates. The second circle represents the background gene count and P value, with longer bars indicating a higher number of genes. The third circle shows the number of DEGs in each pathway, while the innermost circle displays the Rich Factor value for each pathway. (B) The chordal diagram of enriched pathways highlights DEGs related to the MAPK, PPAR, apoptosis, and peroxisome pathways, all of which are associated with the nervous system. |