
- Title
-
miR-23b-3p, miR-126-3p and GAS5 delivered by extracellular vesicles inhibit breast cancer xenografts in zebrafish
- Authors
- Pelisenco, I.A., Zizioli, D., Guerra, F., Grossi, I., Bucci, C., Mignani, L., Girolimetti, G., Di Corato, R., D'Agostino, V.G., Marchina, E., De Petro, G., Salvi, A.
- Source
- Full text @ Cell Commun. Signal.
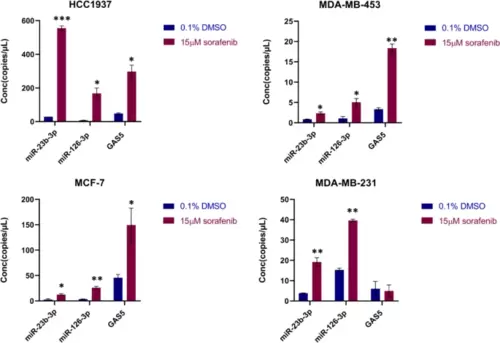
Levels of miR-23b-3p, miR-126-3p, and GAS5 in EVs from breast cancer cells after sorafenib treatment. Levels of miR-23b-3p, miR-126-3p, and GAS5 encapsulated in the EVs were determined using ddPCR technology. Concentration of each target is expressed as copies/µL. Treatment with sorafenib caused dysregulation of the level of the 3 selected ncRNAs. The graphics represent mean value; bars, SD. Unpaired t-test was used; *p < 0.05, **p < 0.01, ***p < 0.001. Results are representative of two independent experiments |
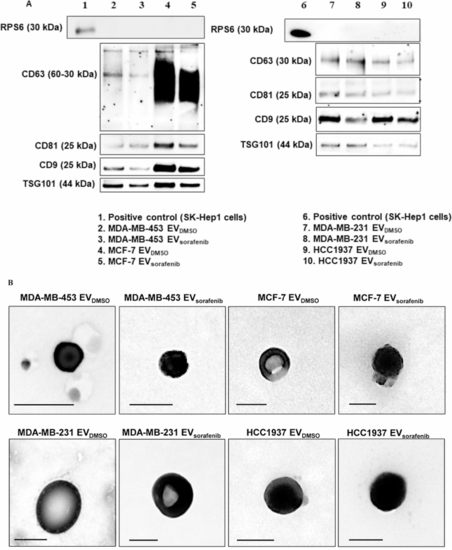
Characterization of the EVs. A Western blot for tetraspanins (CD63, CD81, CD9), TSG101 and RPS6 was performed on EVs purified by immunoprecipitation and derived from MDA-MB-453, MCF-7, MDA-MB-231, and HCC1937 cells treated with sorafenib. B Transmission electron microscopy (TEM) on EVs obtained by ultracentrifugation showed vesicles with characteristic morphology and size, between 50 and 150 nm in diameter. Scale bar, 100 nm |
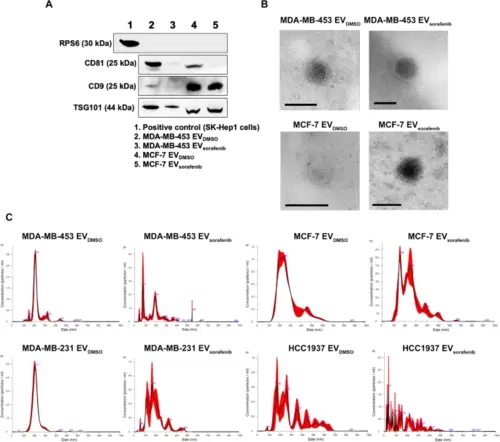
Characterization of EVs obtained with precipitation method. A Western blot for tetraspanins (CD81, CD9), TSG101 and RPS6 was performed on EVs purified with precipitation method and derived from MDA-MB-453 and MCF-7 cells treated with DMSO and Sorafenib. Lysate from SK-Hep1 cell was used as a positive control. B Transmission electron microscopy (TEM) precipitated EVs showed vesicles with characteristic morphology and size of EVs. Scale bar, 100 nm. C Nanoparticle tracking analysis showed heterogeneous size-distribution profiles of the EVs derived from DMSO or sorafenib treated breast cancer cells |
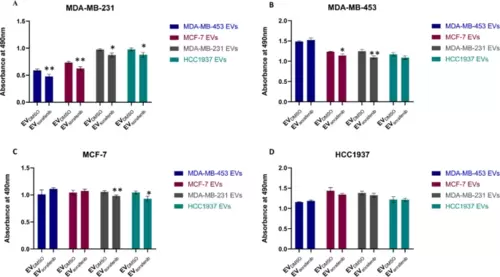
EV-based treatment affected BC cell proliferation. A MDA-MB-231, B MDA-MB-453, C MCF-7, and D HCC1937 cells were treated with different types of enriched EVs for 24 h, and the effects on cell proliferation were assessed by MTT assay. Results are representative of one of two experiments. The graphics represent the average value of five replicates for each condition; the bars represent SD. Unpaired t-test was used; *p < 0.05, **p < 0.01 (n = 53) |
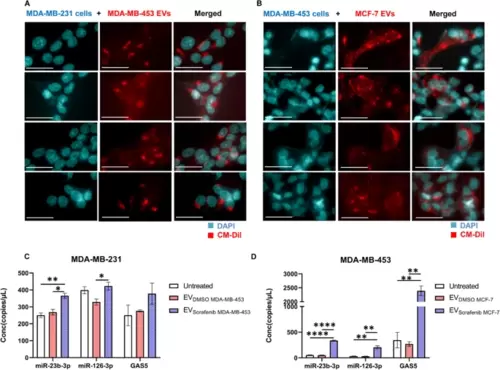
EVs-based ncRNAs delivery to target breast cancer cells. Representative fluorescent microscopy images showing the uptake of MDA-MB-453 and MCF-7 derived extracellular EVs labeled in red by A MDA-MB-231 and B MDA-MB-453 recipient BC cells at 24 h post-treatment. Scale bars correspond to 30 μm for 63x magnification, and the fluorescent dyes used were DAPI (blue) for nuclei and CM-DiI (red) for EVs. The expression levels of cellular miR-23b-3p, miR-126-3p, and GAS5 were determined in terms of copies/µL using ddPCR technology. C Treatment with EVsorafenib derived from MDA-MB-453 resulted in an increased expression level of the three selected ncRNAs in MDA-MB-231 target cells. D Similarly, MDA-MB-453 target cells treated with EVsorafenib released by MCF-7 showed the same outcome. The histograms represent mean value of two replicates for each condition; bars, SD. *p < 0.05, **p < 0.01, ****p < 0.0001 in one-way ANOVA followed by Tukey’s test. Results are representative of two independent experiments |
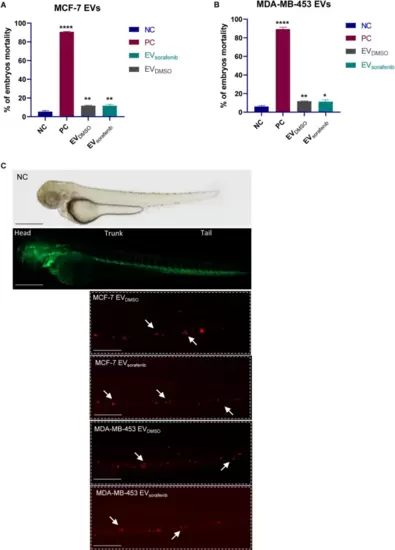
EVs uptake in zebrafish. Fluorescent microscopy images of CM-DiI labeled EVs uptake by the recipient transgenic zebrafish line Tg(kdrl:EGFP). Mortality analysis of embryos treated with EVs derived from A MCF-7 and B MDA-MB-453 at 72 hpf; data are representative of three replicates (n = 30 for each group) and are shown as the mean ± standard deviation; negative control embryos (NC) were exposed to 0.1% DMSO in fish water, while the positive control embryos (PC) were exposed to 3,4-DCA dissolved in fish water at a concentration of 3.74 mg/L; unpaired t-test was used; *p < 0.05, **p < 0.01, ****p < 0.0001. C EVDMSO and EVsorafenib derived from MCF-7 and MDA-MB-453 cells can be observed at the tail level. Green signal indicates fluorescent vasculature, while red signal indicates the cancer cells. The absence of the luminescent signal marks the untreated fish used as negative control (NC). Magnification 20x and 32x. Scale bars correspond to 500 μm |
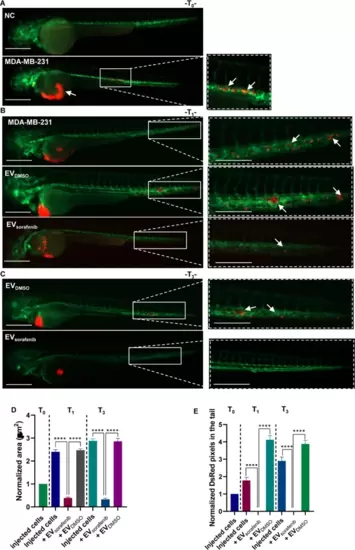
Effects of enriched EVs-based treatment on MDA-MB-231 xenografts at T0, T1, and T3. A Representative lateral view pictures of not injected Tg (kdrl:EGFP) fish were used as negative control (NC); CM-Dil labeled MDA-MB-231 breast cancer (BC) cells were injected into the perivitelline space of the 48 hpf zebrafish. Representative images of the zebrafish were acquired 2 h post-injection (hpi) (T0); B at 24 hpi (T1) trunk and tail pictures were obtained, migrated cell number is regarded as an indicator of the aggressivity of MDA-MB-231 BC cells. C At 72 hpi (T3) illustrative pictures were acquired, and arrows indicate the cancer cell cluster formation at the tail level. Green signal indicates fluorescent vasculature, while red signal indicates the cancer cells. Scale bars correspond to 500 μm for magnification of 20x and 32x. D The quantification of the tumor area in the xenografts and E the assessment of the tumor cell number in the tail were conducted at T0, T1, and T3. Data are representative of three replicates (n = 30 for each group) and are shown as the mean ± standard deviation. Tumor area and the number of pixels in the tail were normalized to the same parameters obtained in fish injected with MDA-MB-231 cells at T0. ****p < 0.0001 in one-way ANOVA followed by Tukey’s test |
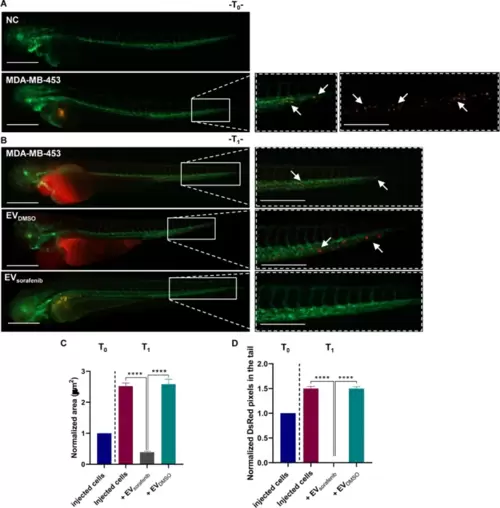
Effects of enriched EVs-based treatment on MDA-MB-453 xenografts at T0 and T1. A Lateral view images of not injected Tg (kdrl: EGFP) zebrafish were selected as the negative control (NC). CM-Dil labeled MDA-MB-453 breast cancer (BC) cells were injected into the perivitelline space of zebrafish at 48 hpf. Representative images of the zebrafish were captured at 2 hpi (T0). B At 24 hpi (T1), illustrative pictures of the trunk and tail were taken, with arrows indicating the presence of numerous cancer cells in the tail, reflecting the progression and aggressiveness of MDA-MB-453 BC cells. Green signal indicates fluorescent vasculature, while red signal indicates the cancer cells. Scale bars correspond to 500 μm for magnification of 20x and 32x. C Quantification of the tumor area of the xenografts as well as D quantification of tumor cells in the tail were determined at T0 and T1. Data are representative of three replicates (n = 30 for each group) and are shown as the mean ± standard deviation. Tumor area and the number of pixels in the tail were normalized to the same parameters obtained in fish injected with MDA-MB-453 cells at T0. ****p < 0.0001 in one-way ANOVA followed by Tukey’s test |
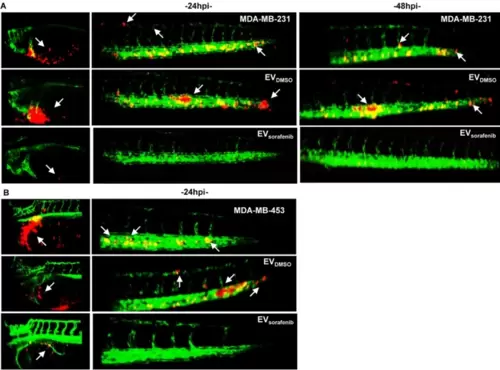
Imaging of cancer xenografts and micrometastases in zebrafish acquired by digital light sheet microscopy. A Representative image of the yolk sac and tail regions were captured at 24 h and 48 h after microinjection of MDA-MB-231 breast cancer (BC) cells labeled in red. B Additionally, images were taken at 24 h after microinjection of MDA-MB-453 BC (red). Arrows were used to indicate the presence of tumor masses, micrometastases in the tail, as well as the formation of clusters of cancer cells (n = 30 for each group) |
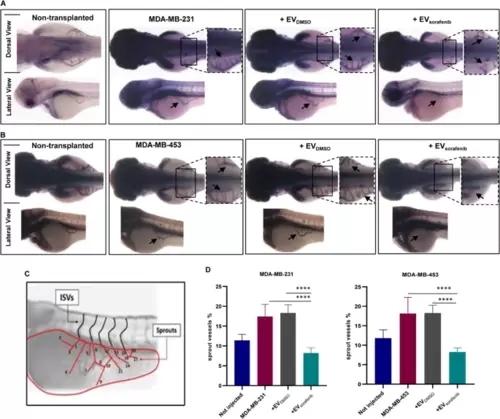
Xenotransplantation-induced angiogenesis in the zebrafish embryos. The alkaline phosphatase assay was performed to assess the angiogenic potential of two different cancer cell lines, A MDA-MB-231 and B MDA-MB-453, in embryos that were either untreated or treated, with enlargement of the sub-intestinal venous plexus (SIVP) region at 72 hpf (dorsal and lateral view). Magnification 32x. C The scheme depicts the counting of ectopic sprouts. D To present the results, a graph was generated showing the average number of SIVP branches at 72 hpf. Data are representative of three replicates (n = 30 for each group) and are shown as the mean ± standard deviation. ****p < 0.0001 in one-way ANOVA followed by Tukey’s test |