
Fig. 8
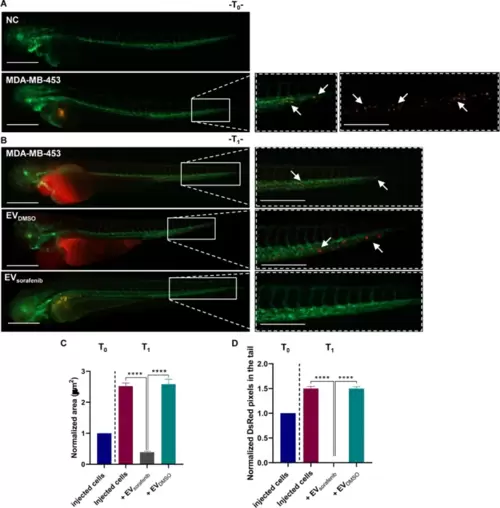
Effects of enriched EVs-based treatment on MDA-MB-453 xenografts at T0 and T1. A Lateral view images of not injected Tg (kdrl: EGFP) zebrafish were selected as the negative control (NC). CM-Dil labeled MDA-MB-453 breast cancer (BC) cells were injected into the perivitelline space of zebrafish at 48 hpf. Representative images of the zebrafish were captured at 2 hpi (T0). B At 24 hpi (T1), illustrative pictures of the trunk and tail were taken, with arrows indicating the presence of numerous cancer cells in the tail, reflecting the progression and aggressiveness of MDA-MB-453 BC cells. Green signal indicates fluorescent vasculature, while red signal indicates the cancer cells. Scale bars correspond to 500 μm for magnification of 20x and 32x. C Quantification of the tumor area of the xenografts as well as D quantification of tumor cells in the tail were determined at T0 and T1. Data are representative of three replicates (n = 30 for each group) and are shown as the mean ± standard deviation. Tumor area and the number of pixels in the tail were normalized to the same parameters obtained in fish injected with MDA-MB-453 cells at T0. ****p < 0.0001 in one-way ANOVA followed by Tukey’s test |