
Fig. 7
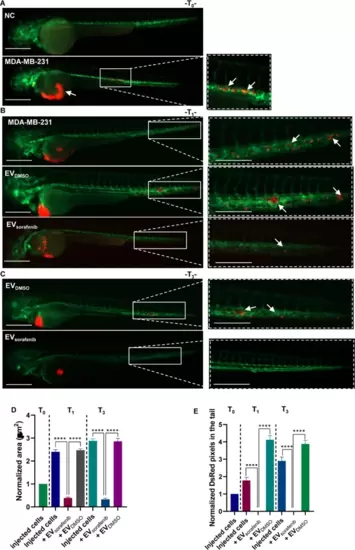
Effects of enriched EVs-based treatment on MDA-MB-231 xenografts at T0, T1, and T3. A Representative lateral view pictures of not injected Tg (kdrl:EGFP) fish were used as negative control (NC); CM-Dil labeled MDA-MB-231 breast cancer (BC) cells were injected into the perivitelline space of the 48 hpf zebrafish. Representative images of the zebrafish were acquired 2 h post-injection (hpi) (T0); B at 24 hpi (T1) trunk and tail pictures were obtained, migrated cell number is regarded as an indicator of the aggressivity of MDA-MB-231 BC cells. C At 72 hpi (T3) illustrative pictures were acquired, and arrows indicate the cancer cell cluster formation at the tail level. Green signal indicates fluorescent vasculature, while red signal indicates the cancer cells. Scale bars correspond to 500 μm for magnification of 20x and 32x. D The quantification of the tumor area in the xenografts and E the assessment of the tumor cell number in the tail were conducted at T0, T1, and T3. Data are representative of three replicates (n = 30 for each group) and are shown as the mean ± standard deviation. Tumor area and the number of pixels in the tail were normalized to the same parameters obtained in fish injected with MDA-MB-231 cells at T0. ****p < 0.0001 in one-way ANOVA followed by Tukey’s test |