
FIGURE
Fig. 1
Fig. 1
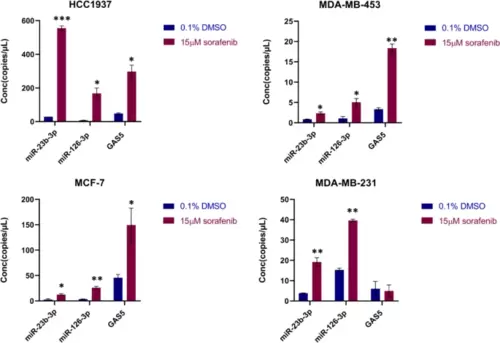
Levels of miR-23b-3p, miR-126-3p, and GAS5 in EVs from breast cancer cells after sorafenib treatment. Levels of miR-23b-3p, miR-126-3p, and GAS5 encapsulated in the EVs were determined using ddPCR technology. Concentration of each target is expressed as copies/µL. Treatment with sorafenib caused dysregulation of the level of the 3 selected ncRNAs. The graphics represent mean value; bars, SD. Unpaired t-test was used; *p < 0.05, **p < 0.01, ***p < 0.001. Results are representative of two independent experiments |
Expression Data
Expression Detail
Antibody Labeling
Phenotype Data
Phenotype Detail
Acknowledgments
This image is the copyrighted work of the attributed author or publisher, and
ZFIN has permission only to display this image to its users.
Additional permissions should be obtained from the applicable author or publisher of the image.
Full text @ Cell Commun. Signal.