
Fig. 6
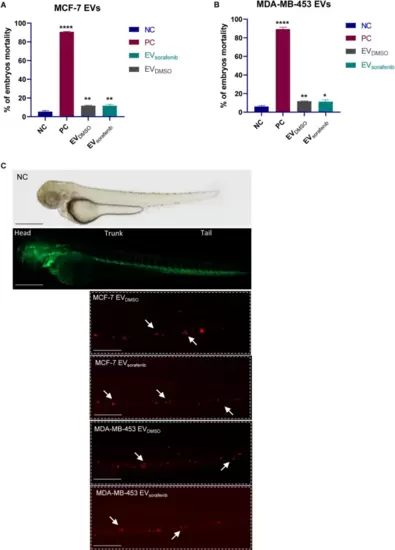
EVs uptake in zebrafish. Fluorescent microscopy images of CM-DiI labeled EVs uptake by the recipient transgenic zebrafish line Tg(kdrl:EGFP). Mortality analysis of embryos treated with EVs derived from A MCF-7 and B MDA-MB-453 at 72 hpf; data are representative of three replicates (n = 30 for each group) and are shown as the mean ± standard deviation; negative control embryos (NC) were exposed to 0.1% DMSO in fish water, while the positive control embryos (PC) were exposed to 3,4-DCA dissolved in fish water at a concentration of 3.74 mg/L; unpaired t-test was used; *p < 0.05, **p < 0.01, ****p < 0.0001. C EVDMSO and EVsorafenib derived from MCF-7 and MDA-MB-453 cells can be observed at the tail level. Green signal indicates fluorescent vasculature, while red signal indicates the cancer cells. The absence of the luminescent signal marks the untreated fish used as negative control (NC). Magnification 20x and 32x. Scale bars correspond to 500 μm |