
- Title
-
Extracellular vesicles rich in HAX1 promote angiogenesis by modulating ITGB6 translation
- Authors
- You, B., Pan, S., Gu, M., Zhang, K., Xia, T., Zhang, S., Chen, W., Xie, H., Fan, Y., Yao, H., Cheng, T., Zhang, P., Liu, D., You, Y.
- Source
- Full text @ J Extracell Vesicles
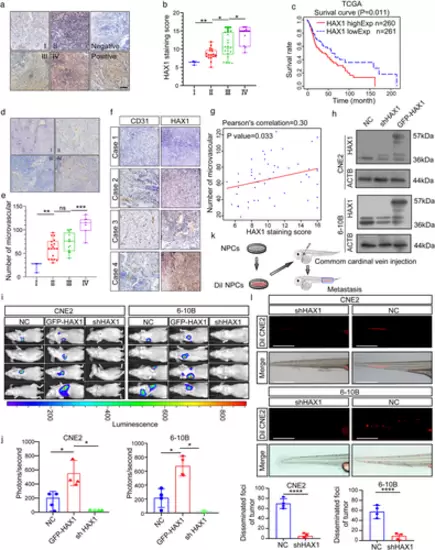
HAX1 overexpression is related to NPC metastasis and angiogenesis. (a) Representative immunohistochemical analysis (IHC) images of HAX1 staining in tumour tissues of different clinical grades from patients with NPC, bar: 100 µm. (b) Statistical comparison of HAX1 scores in different clinical grades. (*p < 0.05, **p < 0.01, one-way ANOVA). (c) Kaplan–Meier curves showing the correlation between HAX1 expression and overall survival by the log-rank test (Data from TCGA-HNSCC). (d) Tumours were analysed by IHC for microvessel densities (MVDs), bar: 100 µm. (e) Statistical comparison of number of MVDs in different clinical grades (**p < 0.01, ***p < 0.001, one-way ANOVA). (f) Representative IHC images of MVDs and HAX1 staining. (g) Spearman correlation between HAX1 score and MVDs in NPC. Pearson correlation coefficient (r2) and p-values are shown. (h) Up: the HAX1 levels of CNE2-NC, CNE2-shHAX1 and CNE2-GFP-HAX1 were measured by Western blotting. Down: The HAX1 levels of 6-10B-NC, 6-10B-shHAX1 and 6-10B-GFP-HAX1 were measured by Western blotting. (i) Visualisation of lung metastasis after intravenous injection of transfected NPC cells in BALB/c mice. (j) Mean fluorescence intensity (*p < 0.05, one-way ANOVA). (k) Schematic diagram of common cardinal vein injection in zebrafish. (l) NPC cells (red) were injected into the common cardinal vein of zebrafish at 48 hpf, and photographed using a confocal microscope (representative of three embryos per group, bar: 200 µm (m) Quantification of migratory cell numbers. (****p < 0.0001, Student's t-test) |

HAX1-rich EVs promote angiogenesis in vitro. (a) Schematic diagram of HUVECs processing. (b–g) Co-culture of HUVECs with NPC-NC or NPC-shHAX1 (b) The migration potential of HUVECs was measured using the Transwell assay, bar: 100 µm. (c) Statistical comparison of the cell number. (**p < 0.01, Student's t-test). (d, e) Tube formation assays were performed to measure the tube forming ability of HUVECs, bar: 100 µm. (**p < 0.01, Student's t-test). (f, g) The migration potential of HUVECs was measured using the wound closure assay, bar 200 µm. (**p < 0.01, Student's t-test). (h, i) After 4 h of treatment with DMSO or GW4869, the tube forming ability of HUVECs co-cultured with two groups of CNE2 was measured. (n.s. p > 0.05 and **p < 0.01, Student's t-test). (j) CNE2 cells treated with DMSO or GW4869 for 4 h, and measured the density of EVs in CNE2 cells supernatants (k) Representative transmission electron micrograph of EVs derived from CNE2 cells, bar 100 nm. (l) Western blotting analysis for CD63, CD9, Alix, Flotillin 1, TSG101, Albumin and actinin-4 in CNE2 cells and CNE2 cells EVs. (m, n) Tube formation assays were performed to measure the tube forming ability of HUVECs treated with two groups of EVs, bar: 100 µm. (**p < 0.01, Student's t-test). (o) Top, HUVECs were cocultured with CNE2 cells transfected with fluorescent GFP-HAX1 lentivirus in a chamber. Down, uptake of EVs released by CNE2 cells in HUVECs. Images were obtained by confocal microscopy, blue: Hoechst staining; red: PKH26-labelled EVs; green: GFP-HAX1, bar: 25 µm |

EVs rich in HAX1 promote angiogenesis in vivo.(a) The blood vessel formation ability treatment with EVs derived from CNE2-NC or CNE2-shHAX1 was measured using the CAM assay. Red arrows: blood vessel sprouts, bar 200 µm. (b, c) Injection of two groups of EVs affected the branching of zebrafish intersegmental vessels. Red arrows: sprouts of intersegmental vessel, bar: 200 µm. (c) The number of sprouts of intersegmental vessels at 40 hpf. (***p < 0.001, one-way ANOVA). (d) Schematic diagram of tail vein injection protocol of EVs and CNE2 cells. (e, f) Visualization of lung metastasis in BALB/c mice. (*p < 0.05, ***p < 0.001, one-way ANOVA) |
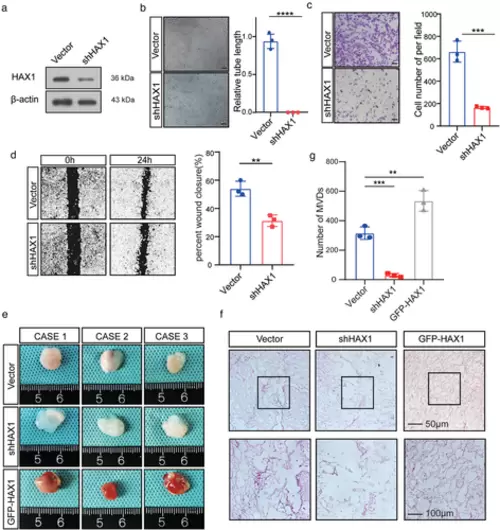
HAX1 expression affects the tube formation ability of HUVECs. (a) HUVECs transfected with control (CON) or shHAX-1 were analysed by Western blotting. (b–d) HUVECs were transfected with the control (CON) or shHAX-1 lentivirus, followed by angiogenesis-related experiments. (b) Tube formation assays were performed to measure the tube forming ability of two groups of HUVECs, bar: 100µm. (****p < 0.0001, Student's t-test). (c) The migration potential of HUVECs was measured using the Transwell assay, bar: 100 µm. (**p < 0.01, Student's t-test) (d) The migration potential of HUVECs was measured using the wound closure assay, bar: 200 µm. (***p < 0.001, Student's t-test). (e, f) HUVECs were mixed with Matrigel for subcutaneous injection. (e) Left, gross-observation of HAX1-modulated angiogenesis in Matrigel plugs. Right, H&E was performed to observe blood vessel formation. Scale bar in 200× images: 100 µm. Scale bar in 400× images: 50 µm. (f) Quantitative evaluation of angiogenesis based on vessel area (**p < 0.01, ***p < 0.001, one-way ANOVA) |
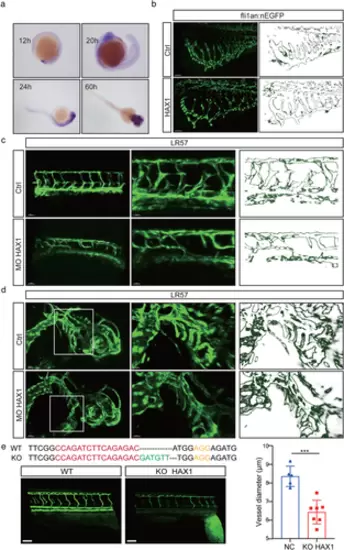
HAX1 regulates vascular morphogenesis in zebrafish. (a) In situ hybridization was performed on zebrafish embryos at 12 hpf, 20 hpf, 24 hpf and 60 hpf to observe the HAX1 level. (b) HAX1 mRNA was injected in the embryo. Left, representative pictures of the sub-intestinal vessel using confocal microscopy. Right, stroke outlines of the sub-intestinal vessel. (c, d) Reduced HAX1 level. Left, representative pictures of (c) the intersegmental vessel and (d) head vessel. Right, stroke outlines of the intersegmental vessel. (e) Top: CRISPR/Cas9 targeting sequences. Down, representative pictures of the intersegmental vessel, bar: 20 µm. (***p < 0.001, Student's t-test) |
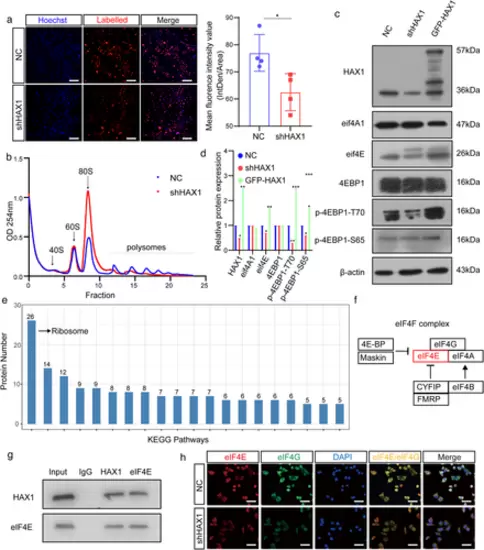
HAX1 promotes protein translation in HUVECs. (a) Analyses of nascent protein synthesis labeled with L-Homopropargyl glycine incorporation, detected in HUVECs-NC and HUVECs-shHAX1 by fluorescence microscopy. Quantify nascent protein expression by the quantification of fluorescence intensity. Blue: nuclei; Red: nascent protein, bar: 100 µm. (*p < 0.05, Student's t-test). (b) Polysome profiling of HUVECs-NC and HUVECs-shHAX1. Absorbance at 254 nm. (c, d) Western blot analysis of the protein levels in HUVECs-NC and HUVECs-shHAX1 (*p < 0.05, **p < 0.01, p < 0.001, Student's t-test). (e) KEGG pathway enrichment analysis of the mass spectrometry results. (f) Schematic diagram of HAX1 affecting eIF4F. (g) Co-immunoprecipitation analysis between HAX1 and eIF4E in HUVECs. (h) Immunofluorescence of eIF4G and eIF4E in HUVECs, bar: 50 µm |
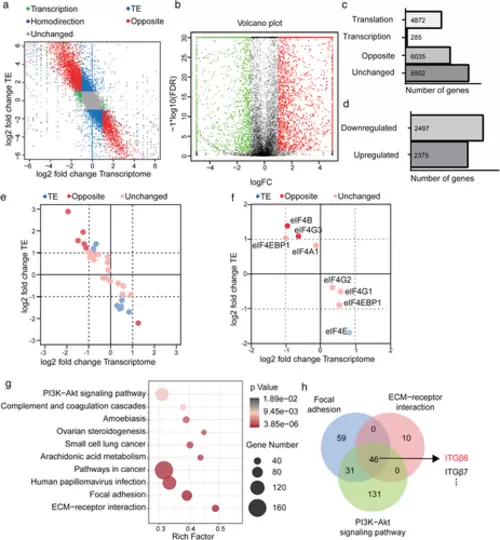
HAX1 regulates global gene translation in HUVECs. (a) Genome-wide distribution of ribosome profiling and RNA abundance between HUVECs-NC and HUVECs-shHAX1. Green: transcription; Blue: translation; Purple: homodirection; Red: opposite. (b) The volcano plot reflects changes in translation efficiency. (c, d) Stacked bar charts indicate (c) the absolute numbers of transcription, translation, homodirection, opposite genes (d) and the number of genes whose translation efficiency is increased or decreased. (e, f) Ribosome profiling of (e) translation initiation factor and (f) the components of eIF4F. (g) KEGG pathways enrichment analysis for genes upregulated in translation efficiency. (h) The Venn diagram shows the overlap of genes in the PI3K signalling pathway, focal adhesion, and ECM-receptor interaction |
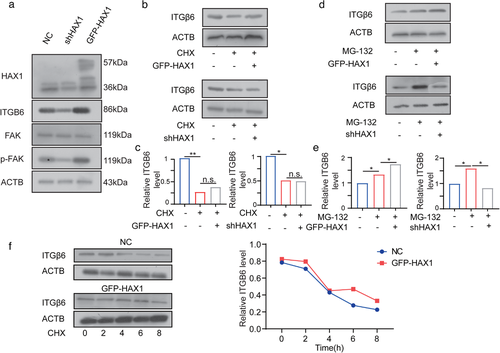
HAX1 enhances ITGB6 translation. (a) Western blot analysis of the protein levels in HUVECs-NC and HUVECs-shHAX1. (b, c) After 24 h treatment with CHX, cells were used for Western blot analysis (d, e) After 24 h treatment with MG132, cells were used for Western blot analysis. (f) HUVECs-NC and HUVECs-GFP-HAX1 were treated with CHX (100 µg/ml) and collected at different time points for Western blot analysis |

HAX1 promotes angiogenesis and metastasis of NPC via the FAK pathway. (a) Western blot analysis of HAX1, ITGB6, FAK and p-FAK. (b–f) Tube forming and migration ability of HUVECs measured using the (c, e) Transwell assay and (d, f) tube formation assay, bar: 100 µm. (n.s. p > 0.05, *p < 0.05, **p < 0.001, one-way ANOVA). (g, h) Visualisation of lung metastasis in BALB/c mice. (n.s. p > 0.05, ***p < 0.001, ****p < 0.05 by one-way ANOVA) |