
Fig. 7
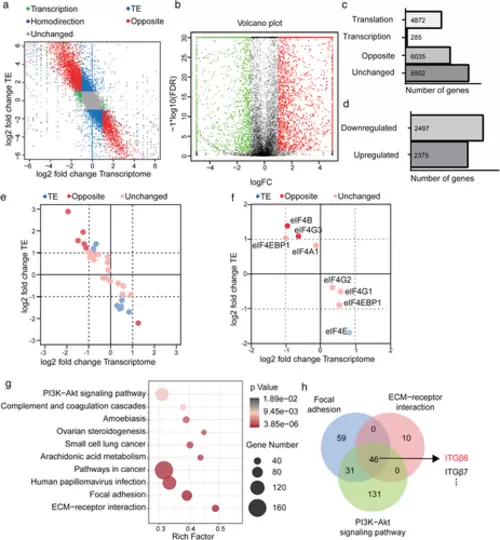
HAX1 regulates global gene translation in HUVECs. (a) Genome-wide distribution of ribosome profiling and RNA abundance between HUVECs-NC and HUVECs-shHAX1. Green: transcription; Blue: translation; Purple: homodirection; Red: opposite. (b) The volcano plot reflects changes in translation efficiency. (c, d) Stacked bar charts indicate (c) the absolute numbers of transcription, translation, homodirection, opposite genes (d) and the number of genes whose translation efficiency is increased or decreased. (e, f) Ribosome profiling of (e) translation initiation factor and (f) the components of eIF4F. (g) KEGG pathways enrichment analysis for genes upregulated in translation efficiency. (h) The Venn diagram shows the overlap of genes in the PI3K signalling pathway, focal adhesion, and ECM-receptor interaction |